


Customer Experience Dashboard: 8 Role-Based Examples


The CX intelligence
platform that's AI-native by design
Book a demoQuick summary
A customer experience dashboard is only useful if it explains why a score moved, not just that it moved. Most stop at the score. A dashboard that gets used has three layers:
- Headline metrics: three to five KPIs, each with a target and a trend.
- Drivers: the themes moving each metric, ranked by impact.
- Verbatims: the customer comments that explain each driver.
Each role then needs its own version, because a CX leader, a support lead and a store manager make different decisions. A BI tool handles headline metrics well, but drivers and verbatims need feedback themed consistently at volume, which is where a CX platform earns its place. Whichever route you take, a dashboard needs an owner, a short list of tiles and a place in an existing routine, or it rarely gets opened.
The question your dashboard can't answer yet
It's Monday, and NPS in Germany has dropped six points. Your chief customer officer wants to know why before Thursday's leadership meeting. The customer experience dashboard shows the drop clearly, in red. It doesn't show what caused it.
So an analyst exports 4,000 survey comments and support tickets into a spreadsheet and starts reading. By Thursday, the answer is a best guess built from the few hundred comments they got through.
That's the gap this guide closes. A CX dashboard earns its place when it answers the question that comes after "what happened": what's driving it, and what customers actually said.
Below, we cover the three layers that make that possible, eight examples of how each role should set one up, the two ways to build it, and the mistakes that leave dashboards unopened. If you want the definition and the feedback sources first, our guide to what a voice of customer dashboard should include covers them.
Why listen to us
Chattermill is a customer experience intelligence platform. It unifies feedback from surveys, support tickets, reviews, social media and call transcripts, then uses our Lyra AI engine to theme it and tie each theme to the metrics teams report on. Building dashboards on that data is how our customers use it every day.
- Uber has worked with us for eight years, and more than 400 people there now use Chattermill across five mega-regions.
- E.ON Next raised its billing NPS from +9 to +22, a 144% increase, after using feedback to prioritize fixes by volume and NPS impact.
- Mindful Chef grew NPS by 20% in 12 months and tracks it weekly on a Chattermill dashboard.
The eight examples below draw on how teams like these describe their own setups in our published customer stories. Every screenshot comes from the Chattermill product.
What belongs on a customer experience dashboard: the three layers
Every useful customer experience dashboard answers three questions in order: what moved, why it moved, and what customers said about it. Each question is a layer, and each layer depends on the one above it.
Layer 1: Headline metrics
These are the three to five customer experience KPIs the audience is accountable for. Typically that means NPS, CSAT, customer effort score, churn, retention, or a custom score like net sentiment. Our guide to customer experience metrics covers how each one works, so we won't repeat it here.
What turns a metric into a useful tile is context. Show each one with its change against the last period, its target, and a trend line long enough to separate a real shift from normal weekly noise. A score of 41 means little on its own. A score of 41, down six points against a target of 45, tells you to keep reading.
Layer 2: The drivers behind them
Drivers are the themes moving each headline metric, ranked by impact rather than by mention count. A theme mentioned 2,000 times with mixed sentiment can matter less than one mentioned 400 times by customers who all became detractors. Impact analysis handles that ranking by calculating how many points each theme adds to or takes off a score.
Drivers also need segments beside them, such as market, channel, product line and customer tier. That's where you find out the six-point drop sits almost entirely with first-time buyers in one region.
Layer 3: The verbatims that explain the drivers
Verbatims are customers' own words, filtered to the driver you're looking at. A theme label like "delivery issues" tells you where to look. Three comments saying the tracking page froze after dispatch tell you what to fix and who owns the fix.
Show a handful of recent verbatims under each driver, with a short summary and a link to the full set, so nobody has to trust a label they can't check. This is the layer most CX dashboards leave out.
8 customer experience dashboard examples by role
The three layers stay the same for every audience. What changes is which customer experience KPIs sit on top, which segments the drivers are split by, and where the verbatims come from. Here's the short version for eight roles, followed by each dashboard in detail.
1. CX leader dashboard
The question it answers: which customer problems should my team take on this quarter, and are last quarter's fixes working?
- Headline metrics: NPS or CSAT across all channels, net sentiment and total feedback volume, each against last quarter.
- Drivers: the top themes by impact, split by journey stage, with new or fast-growing themes flagged.
- Verbatims: a short summary and two or three comments per driver, so whoever owns each fix hears the problem in customers' words.
Renata Vasconcellos de Sa, Group Product Ops Lead at Uber, checks hers daily: "The real magic happens when I can 'double-click' on any anomaly or unexpected change to explore the details behind it."
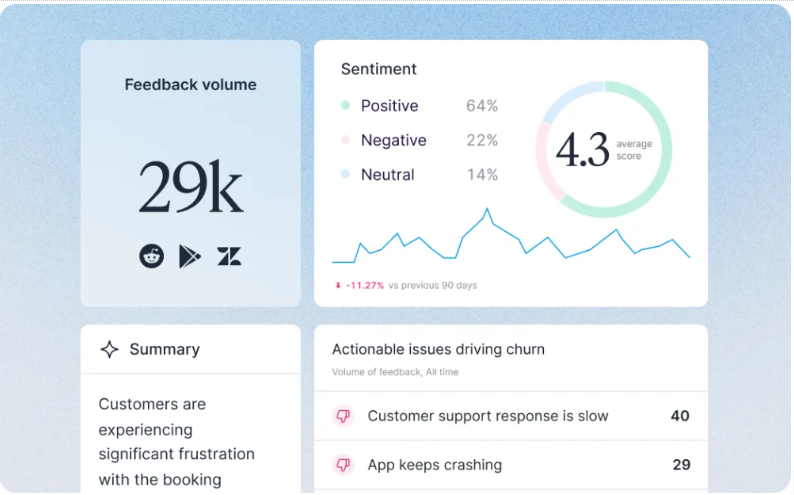
A CX team dashboard with feedback volume by source, the sentiment split, an AI summary and the issues driving churn.
2. Executive dashboard
The question it answers: is customer experience helping or hurting revenue and retention, and where should we invest next?
- Headline metrics: NPS against target over 12 months, retention or churn, and revenue at risk from detractors.
- Drivers: the three themes that moved NPS most this quarter, each with the number of customers affected.
- Verbatims: one representative quote per driver. Executives will read one quote. They won't read twenty.
The tile that wins budget is the one linking scores to money. Steve Crolic, Associate Director at HelloFresh, explains their approach: "The way we combine Chattermill insights with our sales data allows us to easily link NPS responses to our customer base." Once higher scores line up with higher retention on the same screen, a driver dragging NPS down becomes a revenue problem, not a CX one.
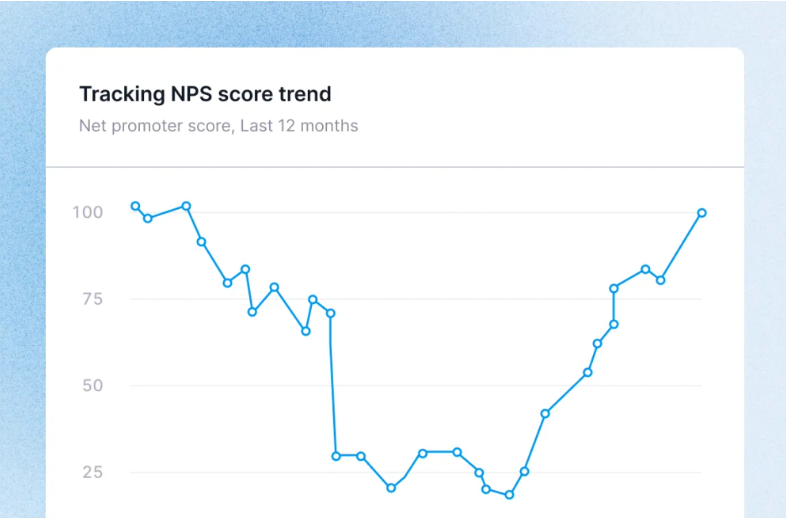
A 12-month NPS trend, the anchor tile for an executive view.
3. Support lead dashboard
The question it answers: which contact reasons are rising, and which can we remove at the root?
- Headline metrics: contacts per order or per active customer, repeat contact rate, CSAT and first contact resolution.
- Drivers: contact reasons ranked by volume and growth, each marked as preventable when a product, policy or delivery fix would have stopped it.
- Verbatims: excerpts from tickets, chats and call transcripts showing the step where customers got stuck.
Use ratios rather than raw counts here, because ticket volume grows with order volume. This dashboard also needs an alarm, not just a chart. Anomaly detection flags when a theme breaks its expected range and posts the alert to Slack, so the support lead hears about a spike on day one instead of at the monthly review.
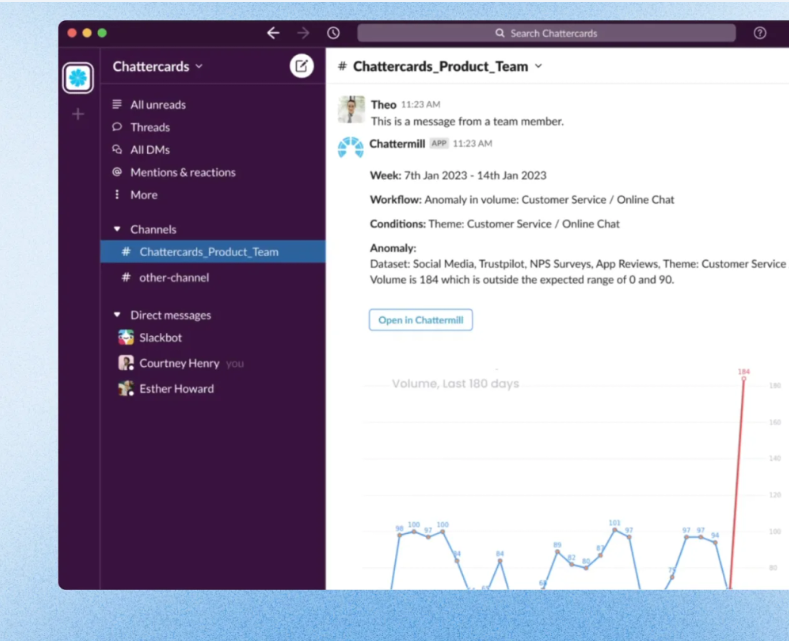
An anomaly alert in Slack: online chat feedback hit 184 in one week against an expected range of 0 to 90.
4. Product manager dashboard
The question it answers: which bugs and gaps hurt sentiment most, and what should go on the roadmap next?
- Headline metrics: app store rating, CSAT or sentiment on key journeys like sign-up, booking and checkout, and NPS by product.
- Drivers: issues by product area, platform and app version, ranked by impact, so a release regression stands out within days.
- Verbatims: the newest app reviews and in-app comments for each issue, with the device and version attached.
The payoff is evidence a product manager can take into planning. At E.ON Next, feedback showed customers struggling to read their smart meters, which led to a new app built to guide them through it.
Mo Nuur, Product Lead for CX & Digital, sums up what that changes: "We want to prioritize this feature next, because we have the data to show that it's a significant pain point for customers." Here's how to find the root cause of product NPS declines.
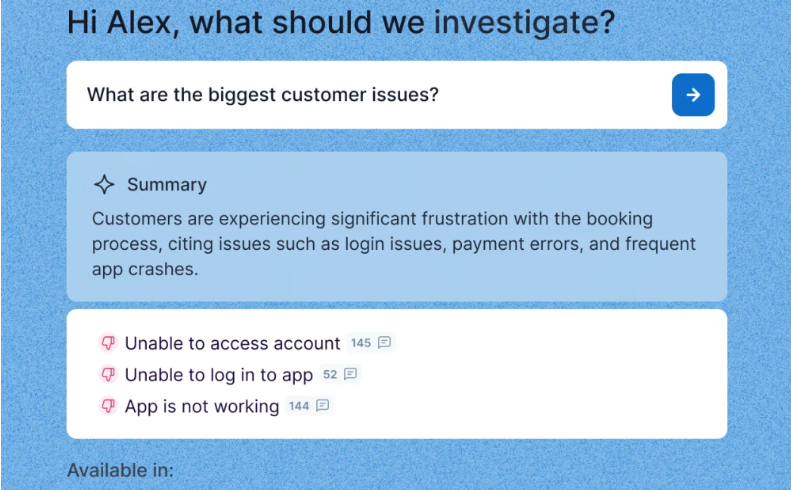
An AI summary of the biggest customer issues, with a comment count for each issue.
5. Store or market manager dashboard
The question it answers: how does my store or market compare with its peers, and what can I fix locally?
- Headline metrics: location NPS or CSAT and average review rating, against last quarter and against similar locations.
- Drivers: the themes pulling this location below its peer group, such as queue times, stock availability or staff knowledge.
- Verbatims: post-visit survey comments and Google reviews tagged to the location, showing which department or shift they point to.
Uber's regional team gets a monthly Chattermill report on how regions differ and how countries vary within them. Compare within a market, though. Nielsen Norman Group reports on a Qualtrics XM Institute study of 18 countries in which consumers in Japan and South Korea gave negative NPS even to companies they liked, while liked companies in India and Mexico scored 60 or higher. So set targets per market instead of ranking every country in one league table.
6. Operations and delivery dashboard
The question it answers: which fulfillment failures cost us most, and which partner is behind them?
- Headline metrics: delivery CSAT, on-time rate and order-status contacts per 1,000 orders, each split by carrier.
- Drivers: fulfillment themes ranked by their impact on delivery CSAT, such as late arrival, wrong address, damaged boxes and missing items.
- Verbatims: comments tagged with carrier and region, so the team can trace the orders behind them.
Footasylum shows why the carrier split matters. A 97% delivery rate looked fine on paper, but combining surveys, CSAT and Trustpilot reviews in Chattermill showed 102 of 785 one-star reviews naming one carrier. Footasylum took that evidence into its contract renegotiation and has since cut contacts per transaction from 0.28 to 0.16. James McGhee, Director of Customer Experience: "Having this data changed the relationship with our delivery company forever."
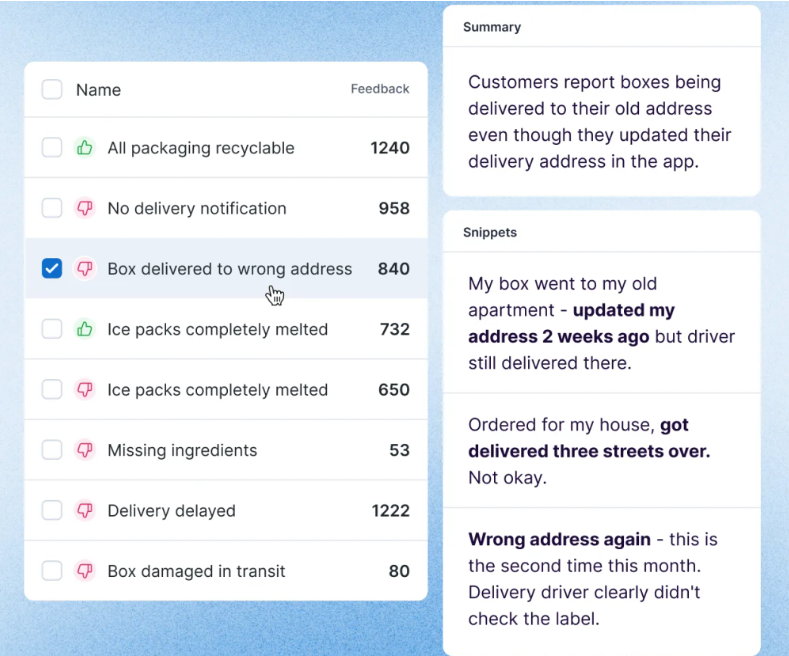
Delivery themes ranked by feedback volume, with a summary and customer snippets for "box delivered to wrong address".
7. Retention and subscription dashboard
The question it answers: why are customers canceling, and which segments are we losing fastest?
- Headline metrics: churn, retention, repeat purchase rate and NPS, split by customer tier or tenure.
- Drivers: themes ranked by how much more negative they are among high-value or at-risk customers than across the base.
- Verbatims: cancellation reasons and the last comments customers left before they churned.
Segmenting is what makes this dashboard work. Mindful Chef found that families rated portion sizes lower than smaller households did. After it increased portions for families, positive sentiment in that segment rose from 38 to 57.
Megan Wood, Head of Customer Performance, explains the weekly habit behind it: "We track it in a dashboard, so we can quickly see if it's been a good or bad week based on what customers are loving or not loving." Our guide to churn analysis goes further on the metrics side.
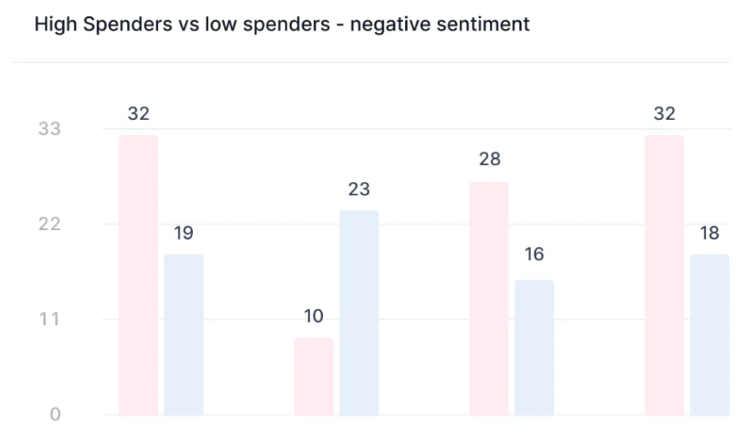
Negative sentiment compared for high spenders and low spenders across four themes.
8. Ecommerce and merchandising dashboard
The question it answers: which products disappoint customers, and why are they coming back?
- Headline metrics: return rate, average product rating, and product NPS or CSAT by category.
- Drivers: return reasons and review themes ranked by impact, such as fit, quality for the price, and the cost of returning.
- Verbatims: product reviews and free-text return reasons for each product, so buyers and designers see the exact complaint.
A return reason code says "didn't fit." The comment beneath it might say the sleeves run short in medium and large, which a buyer can take straight to the supplier. That's why this dashboard needs the free text, not just the codes.
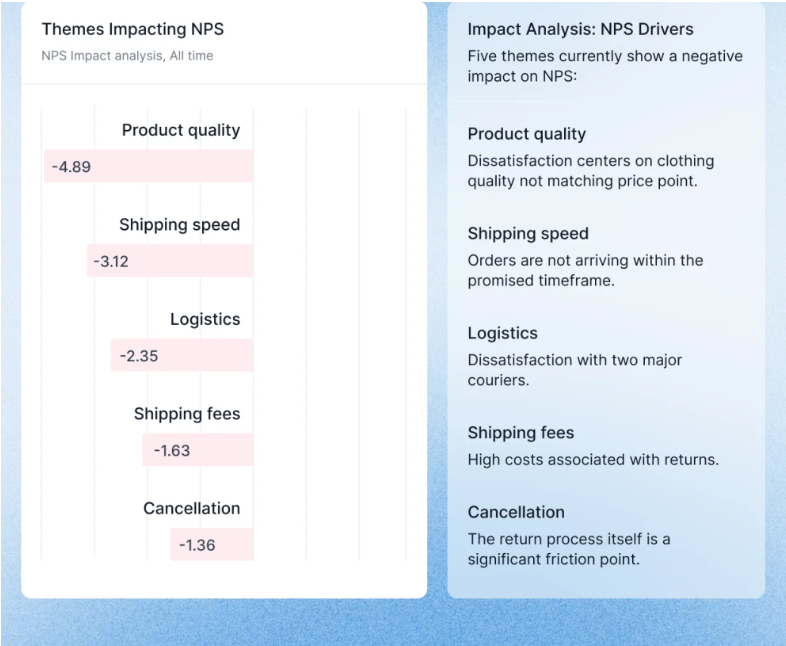
Themes impacting NPS, led by product quality not matching the price point and the cost of returns.
How to build a CX dashboard: BI tool on top of exports vs a CX platform
There are two common routes. The difference is who turns tens of thousands of comments a month into drivers and verbatims, and how consistently.
A BI tool on top of exports
If your data team already runs Power BI, Tableau or Looker, layer one is straightforward. Scores, churn and contact rates are structured data, and a BI tool can put them next to the revenue data already in your warehouse. For an executive view, that's a real advantage.
Layers two and three are where it breaks down. A BI tool can count comments but can't read them, so someone has to theme every response, ticket and review before import, and manual tagging can't keep pace with what a $100M+ brand collects.
A ChatGPT script is faster, but it can label the same complaint differently next month, making a driver look like it's growing when nothing changed for customers. Add multilingual feedback, an export from every tool and a refresh that lags by days, and the "why" arrives after the meeting that needed it.
A CX platform
A CX platform does the theming before anything reaches the dashboard. Chattermill unifies feedback from your survey, support, review and social tools through integrations and applies one consistent set of themes across all of it, in multiple languages.
On Chattermill's reports and dashboards, headline tiles can be NPS, CSAT, net sentiment or a custom metric, impact analysis ranks the drivers, and clicking any data point opens an AI summary backed by the customer quotes behind it. Role-based permissions control who sees what, and workflows send dashboards to Slack or email on a schedule.
Reeshma Clair, Global Voice of Customer Lead at Simply Business, describes how that plays out: "We've set up bespoke dashboards for different teams across the business, tailored to each team's needs, and used workflows to publish them directly in Slack."
The trade-off is one more platform next to the BI stack you already pay for. Chattermill's pricing is usage-based on data sources and feedback volume, with no per-user fees, and quoted on request. Many enterprise teams run both: the CX platform for drivers and verbatims, and a data export into BI where finance wants CX next to revenue.
7 mistakes that make CX dashboards get ignored
A dashboard can track the right numbers and still go unopened after launch week. These are the usual reasons.
- No owner and no decision. If no named person owns a tile and no decision depends on it, a drop becomes everyone's problem and nobody's job. Give every tile an owner and the decision it informs, and remove any tile that can't get both.
- Too many tiles. Stephen Few's widely cited definition of a dashboard has the information "consolidated and arranged on a single screen so the information can be monitored at a glance." If the main view needs scrolling, move the extra tiles into drill-downs.
- No baseline or annotations. A score shown without its previous period, its target, and a marker for that week's app release or price change turns every movement into a debate. Show the change and annotate the events.
- Definitions nobody agreed on. When the dashboard's churn rate differs from the one in the board deck, the meeting becomes an argument about whose number is right. Agree each definition with finance before launch.
- Blended averages that hide a market in trouble. Overall NPS can hold steady while one market or channel falls, because growth elsewhere props up the average. Put key segments side by side instead of trusting the total.
- Verbatims without volume. One vivid comment pasted into a slide can send a team chasing an issue three customers raised. Every quote on the dashboard should sit next to the count and trend of the theme it represents.
- It lives where nobody looks. A dashboard people have to remember to open loses to the inbox. Send a weekly digest, alert in Slack when a driver jumps, and give it a slot in a meeting that already happens. E.ON Next reviews its CX metrics at a regular CX roundtable, and Mindful Chef made NPS a weekly company metric.
Start small, then copy what works
Pick the role with the most pressing question, which is usually the CX leader or the executive team. Put their headline metrics on top, rank the drivers beneath each one by impact, and add the verbatims that explain each driver. When that person opens it every week without a reminder, repeat the pattern for the next role.
If you'd like to see the three layers built on your own feedback, book a demo and we'll walk you through it.
FAQ
What should a customer experience dashboard include?
Three layers: headline KPIs with targets and trends, the drivers moving each one ranked by impact, and the verbatims that explain each driver. Which KPIs go on top depends on the reader: contact rate for a support lead, NPS and retention for an executive.
What's the difference between a CX dashboard and a VoC dashboard?
A CX dashboard is built around one role's decisions and often mixes feedback with operational data like retention, contact rate or on-time delivery. A VoC dashboard focuses on the feedback itself: its sources, themes and sentiment. Our guide to the voice of customer dashboard covers that side in depth.
How is a CX dashboard different from a customer service dashboard?
A customer service dashboard tracks support operations, such as ticket volume, handle time, SLAs and agent performance. A CX dashboard covers the whole journey, from purchase and delivery to product use and renewal. The support lead example above is where the two overlap.
Which customer experience KPIs belong on an executive dashboard?
Keep to the ones that connect to revenue: NPS or CSAT against target, retention or churn, and revenue at risk from detractors. Add the three themes that moved NPS most this quarter, so the discussion goes straight to what to fund.
Can you build a CX dashboard in Power BI or Tableau?
Yes, for headline metrics. Scores and churn are structured data, and BI tools handle them well. Drivers and verbatims need open-text feedback themed consistently first, so teams either tag it by hand, script it, or use a CX platform and export the results into BI.
How many metrics should a CX dashboard show?
Three to five headline KPIs per role is a sensible ceiling for the main view, with everything else in drill-downs. If a tile hasn't informed a decision in a quarter, remove it.


See Chattermill in action on your own feedback
Book a demo


