A Voice of Customer dashboard is a centralized interface that aggregates customer feedback from surveys, support tickets, reviews, social media, and chat into a single view—then uses AI to surface themes, sentiment, and trends your team can act on.
Most organizations collect plenty of feedback. The challenge is that it lives in disconnected systems, making it nearly impossible to see the full picture of customer experience. This guide covers what a VoC dashboard includes, how it differs from other reporting tools, and how to build one that actually drives decisions.
What is a Voice of Customer dashboard
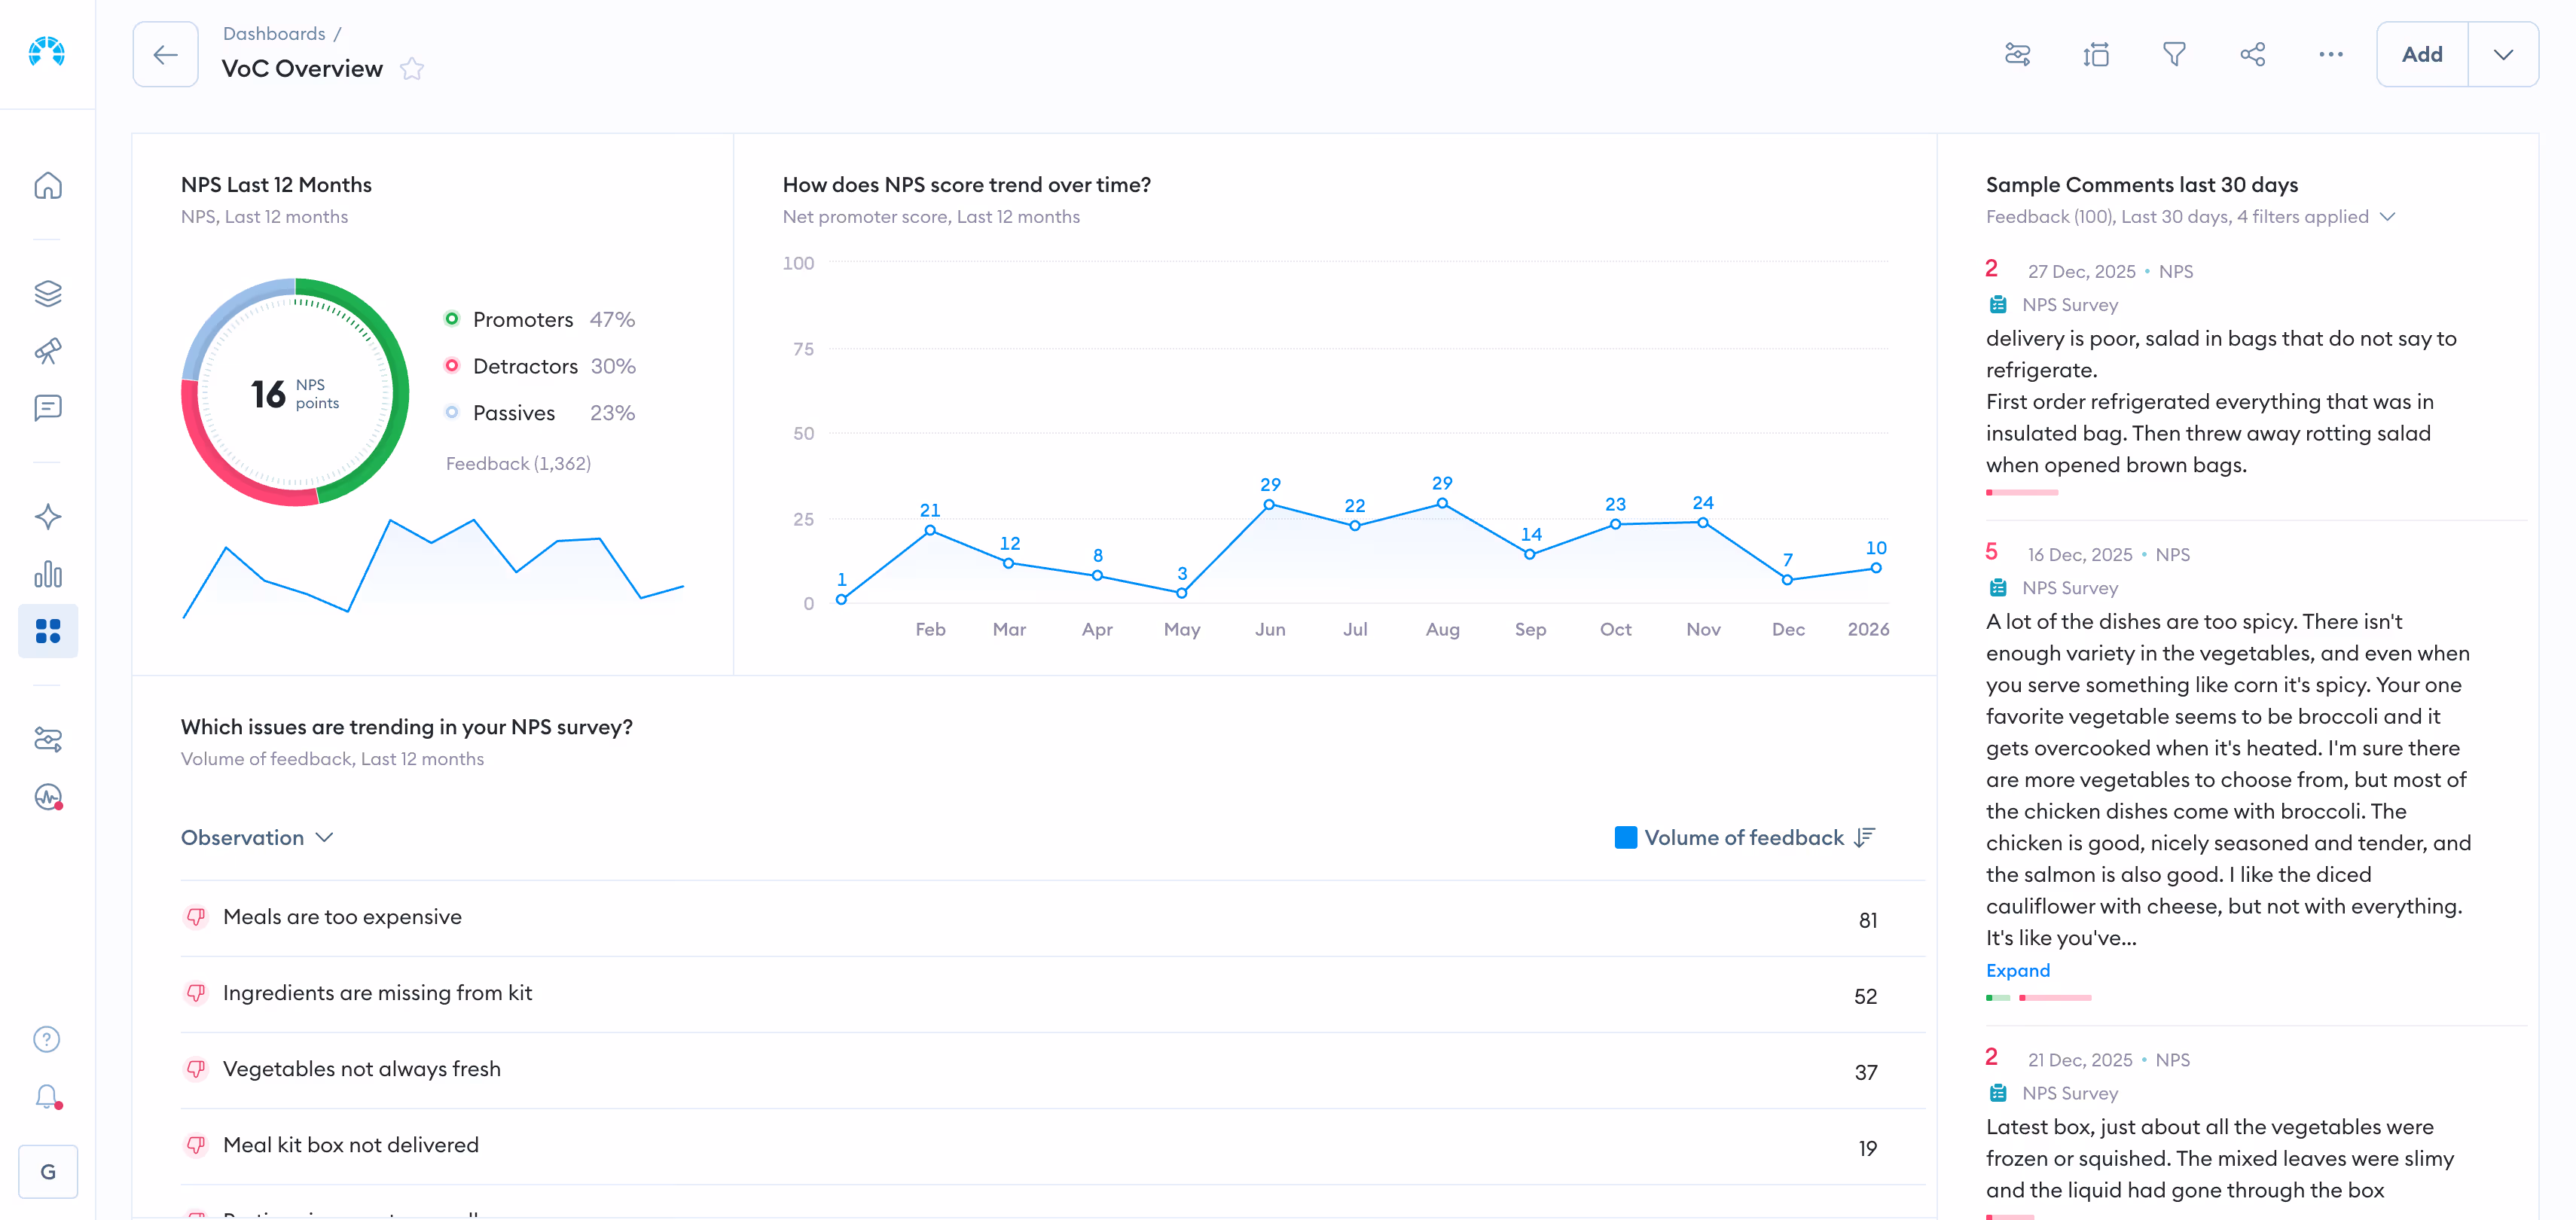
A Voice of Customer (VoC) dashboard is a centralized reporting interface that aggregates customer feedback from multiple sources and visualizes sentiment, themes, and trends in one place. It pulls data from surveys, support tickets, reviews, social media, and chat conversations, then uses AI to categorize and analyze that feedback at scale.
Most organizations already collect feedback. The problem is that it lives in disconnected systems—NPS scores in one tool, support tickets in another, reviews scattered across platforms. According to Zendesk, only 22% of business leaders say their teams share data well.
A VoC dashboard solves this by unifying everything into a single view, transforming raw comments into patterns your team can act on.
Why a Voice of Customer dashboard matters for CX and product teams
When feedback lives in silos, teams make decisions based on incomplete information. Issues escalate before anyone notices. Resources get allocated to the wrong priorities.
A VoC dashboard changes that dynamic by giving CX, product, and leadership a single source of truth for customer feedback. Everyone sees the same customer reality, which reduces debates about what to prioritize.
The practical benefits break down like this:
- Faster issue detection: Emerging problems surface before they escalate into churn or public complaints
- Cross-functional alignment: Every team works from the same view of customer experience
- Prioritization clarity: Resources focus on themes customers mention most frequently and most negatively
- Closed-loop accountability: Teams can track whether actions actually resolve customer pain
How a Voice of Customer dashboard differs from a CX or BI dashboard
You might already have dashboards in your organization. So why add another one?
BI dashboards report on operational metrics like revenue, conversion rates, and support volume. CX dashboards often show experience scores like NPS or CSAT. Both are valuable, yet neither tells you why those numbers look the way they do.
A VoC dashboard goes deeper by unifying structured feedback (scores, ratings) with unstructured feedback (verbatim comments, conversations) to reveal root causes behind your metrics.
| Dashboard Type | Primary Focus | Data Sources | Key Limitation |
|---|---|---|---|
| BI Dashboard | Operational metrics, KPIs | Internal systems, databases | No customer sentiment or verbatim feedback |
| CX Dashboard | Experience scores (NPS, CSAT) | Surveys | Shows "what" but not "why" |
| VoC Dashboard | Themes, sentiment, root causes | Surveys, reviews, support, social, chat | Requires AI and unification to be effective |
Feedback sources to include in a Voice of Customer dashboard
Effective VoC dashboards unify both structured and unstructured data. Structured feedback includes scores and ratings—easy to quantify but limited in depth. Unstructured feedback includes verbatim comments and conversations—rich in insight but harder to analyze at scale.
Customer surveys and NPS, CSAT, and CES responses
Surveys remain a foundational feedback source. NPS (Net Promoter Score) measures loyalty by asking how likely customers are to recommend you. CSAT (Customer Satisfaction) captures satisfaction with specific interactions. CES (Customer Effort Score) gauges how easy you are to do business with. The real value comes from pairing scores with open-ended comments.
Support tickets and contact center conversations
Every support interaction contains feedback—often more candid than survey responses. Customers describe friction points, recurring issues, and the exact language they use to explain problems.
Online reviews and app store ratings
Public reviews on Google, Trustpilot, G2, and app stores reflect brand perception and product gaps. Prospects also see this feedback, making it doubly important to monitor.
Social media and community channels
Customers share unsolicited feedback on social platforms and community forums. This feedback often surfaces emerging trends before they appear in formal channels.
Chat, messaging, and conversational data
Live chat, chatbots, and messaging apps generate high volumes of customer interactions. Conversations here tend to be more immediate and emotionally charged than email.
Product usage and behavioral analytics
Behavioral data shows what customers do. When paired with what they say, you get context that neither source provides alone.
Core views every Voice of Customer dashboard should have
A single dashboard view rarely serves everyone. Executives want summaries while product teams want granular detail. Effective VoC dashboards offer multiple lenses on the same underlying data.
Theme and root cause view
This view groups feedback by AI-detected topics and drivers. Instead of reading thousands of comments, you see that "delivery delays" appeared 2,400 times last month with 78% negative sentiment.
Sentiment and emotion view
Sentiment analysis categorizes feedback as positive, negative, or neutral. More advanced platforms detect specific emotions like frustration, confusion, or delight.
Customer journey and channel view
This view maps feedback to journey stages (onboarding, purchase, support) and channels (web, app, store). It helps identify where in the experience customers struggle most.
Executive summary view
Leadership rarely has time to explore detailed dashboards. An executive summary provides a high-level snapshot: top themes, score trends, and key alerts designed for quick consumption.
Ownership and closed-loop action view
Insights without action are just interesting data. This view tracks which teams own which issues and whether actions have been taken.
Anomaly alerts and insight feed
Real-time notifications surface when sentiment spikes, new themes emerge, or scores drop unexpectedly. Alerts help teams respond before small issues become big problems.
Metrics and KPIs to track on a Voice of Customer dashboard
Metrics connect customer voice to business outcomes. Without them, feedback remains anecdotal rather than actionable.
Theme and topic volume metrics
Track how often specific themes appear over time. A sudden spike in "app crashes" mentions signals a problem worth investigating immediately.
Sentiment and emotion metrics
Measure shifts in positive and negative sentiment across themes, channels, and time periods. Emotion intensity adds another layer—frustrated customers behave differently than merely dissatisfied ones.
Experience score metrics like NPS, CSAT, and CES
Traditional customer experience metrics remain valuable when contextualized with verbatim feedback. A declining NPS tells you something is wrong; theme analysis tells you what.
Driver and impact metrics tied to revenue and retention
The most sophisticated VoC programs connect themes to business outcomes. Which issues correlate with churn? Which improvements drive repeat purchase?
Closed-loop and response performance metrics
Measure time to acknowledge, time to resolve, and follow-up rates. These metrics reveal whether your organization acts on insights or just collects them.
Predictive and early warning metrics
AI-driven indicators can forecast churn risk or emerging dissatisfaction before it shows up in traditional metrics.
How to design and build a Voice of Customer dashboard
Building an effective VoC dashboard requires more than selecting a tool. Teams that succeed typically follow a deliberate process.
1. Define the audience and decisions the dashboard will drive
Start with who will use it and what actions they need to take. A dashboard built for "everyone" often serves no one well.
2. Unify feedback from every channel and language
Consolidate data sources into a single platform. Multilingual feedback is a common blind spot—if you operate globally, your dashboard needs to handle multiple languages without losing nuance.
3. Apply AI to tag themes, topics, and sentiment
Manual tagging doesn't scale. AI enables consistent, real-time categorization across large volumes of feedback.
4. Map metrics to business outcomes
Tie VoC data to retention, revenue, or operational efficiency—not just satisfaction scores.
5. Design role-based views for executives, CX, and product
Each stakeholder needs a tailored view. Executives want summaries; product teams want granular detail.
6. Set up alerts, ownership, and closed-loop workflows
Automate notifications and assign accountability so insights drive action.
Common mistakes to avoid when building a Voice of Customer dashboard
Organizations that struggle with VoC dashboards often make predictable mistakes.
Reporting scores without the why behind them
Dashboards that show NPS without surfacing themes leave teams guessing. Forrester warns that around 15% of CX teams risk a "death spiral" by doubling down on score reporting without real insight. A score tells you how customers feel; verbatim analysis tells you why.
Leaving unstructured feedback out of the dashboard
Ignoring verbatim comments means missing the richest source of insight—according to Gartner, unstructured data represents 80 to 90% of all new enterprise data.
Building one generic view for every audience
Executives, CX managers, and product teams have different needs. A one-size-fits-all dashboard typically satisfies none of them.
Failing to connect insights to business metrics
If you can't connect feedback to business outcomes like churn, revenue, or operational costs, leadership will struggle to prioritize VoC initiatives.
Treating the dashboard as a static report
A VoC dashboard is a living tool with real-time updates and alerts—not a monthly PDF.
Building a Voice of Customer dashboard with Chattermill
Chattermill addresses the challenges outlined above through a unified customer intelligence platform. The platform consolidates feedback from every channel, applies AI-powered theme and sentiment analysis, and delivers role-based dashboards designed for action.
Chattermill handles multilingual feedback, detects anomalies automatically, and connects customer insights to business metrics like NPS, CSAT, and churn.
Book a personalized demo to see how Chattermill can transform your approach to customer feedback.
Frequently asked questions about Voice of Customer dashboards
What is the difference between VoC and VoP?
VoC (Voice of Customer) captures customer feedback and expectations. VoP (Voice of Process) measures internal process performance and capability. VoC tells you what customers want; VoP tells you what your processes can deliver.
What are examples of Voice of the Customer data?
Examples include survey responses, NPS comments, support tickets, online reviews, social media mentions, chat transcripts, app store ratings, and community forum posts.
Who should own the Voice of Customer dashboard in an organization?
Ownership typically sits with CX, insights, or product teams. However, cross-functional visibility is essential—the dashboard serves its purpose only when insights reach the teams who can act on them.
How often should a Voice of Customer dashboard be updated?
Modern VoC dashboards update in real time or near real time, enabling timely detection of emerging issues rather than discovering problems weeks after they started.
What tools can be used to build a Voice of Customer dashboard?
Teams use dedicated VoC platforms like Chattermill, or combine survey tools, BI software, and text analytics solutions. Unified platforms reduce complexity and provide more consistent insights.