We now live in a world where customers have an infinite supply of products and services to choose from, and it's getting harder and harder to stand out from the crowd. Customers have become less responsive to the endless conveyor belt of product releases, and the countless ads and marketing campaigns pinged to their screens daily.
Think back to a time where you went to a restaurant based on a giant ad? Most likely very few times. How many times, in contrast, have you followed the recommendation of a friend or a positive review in a magazine or newspaper? Unbiased references by friends, experts and families carry tremendous power.
People now care more about relationships and experiences with brands and CEOs are starting to take notice, according to "Closing the Customer Experience Gap," by HBR nearly three-quarters of business leaders (73%) said that delivering relevant and reliable customer experiences is critical to their company's overall business performance today.
Driving blind when carrying out initiatives to enhance your customer experience is a potentially fatal and risky tactic to pursue.
To measure customer experience (CX), you need a framework that tells you not only how good your customers' experiences are but also how to improve them and what benefits to expect from doing so. You also need tools and processes to turn CX measurement insights into actions that will enhance customer experience over time.
As the great management thinker Peter Drucker is often quoted as saying,
"If you can't measure it, you can't improve it."
It's crucial you measure what matters.
What Does It Mean to Measure Customer Experience Metrics?
Forrester defines customer experience measurement as:
Quantifying the quality of experiences and their link to the organization's overall metrics.
So what does this mean? It requires teams to:
- Track and analyse what happens when customers interact with their brand, how customers perceive those interactions, and what customer do as a result.
- Communicate CX metrics with actionable insights to employees and partners.
Why measuring customer experience metrics matter
Company Alignment
Measuring the success of a support rep based on the total number of calls they respond to per day does not align their work to making the customer happy. A support agent will be conscious of their manager assessing individual performance based on the number of requests completed per day.
It is within their self-interest to keep calls short and sidestep challenging customer problems. Forcing behaviour such as offloading hard to solve problems to a different team, or avert solving a problem because it will be too timely or complicated to fix. A situation where all the actors from the employee, customer and organisation lose out.
Prioritise CX Improvement Efforts
Using metrics as a guide, CX teams can find the biggest, most damaging issues their customers face. What's more, they can go beyond detecting problems and identify opportunities to delight. An organisation can track CX scores and analyse open-ended survey responses to understand topics or themes that emerge from customer feedback data to provide actionable points to focus improvement efforts.
Understand CX Performance
By measuring what customers think about their experience with an organization, you can quantify the customer experience experience and track whether that number goes up or down over time. To continuously understand how it is performing against customer expectations and if it is on target.
For those of you well accustomed to customer experience metrics skip to the later sections where we cover advanced analytics and analysing customer feedback.
The 3 Most Popular Customer Experience Metrics
1. Net Promoter Score (NPS)
First developed in 2003 by Bain and Company, it’s now used by millions of businesses to measure and track how they’re perceived customers. Net Promoter Score (NPS) measures the loyalty of customers to a company. NPS scores are measured with a single question survey and reported with a number from 0-100, a higher rating is desirable.
The survey question gauges customer loyalty by asking a straightforward question, “On a scale of zero to ten, how likely are you to recommend X product/service to a friend?”Respondents answer with either 0-10 or “not at all likely” to “extremely likely.” Brands can come up with an aggregate score by removing the neutral responses, and subtracting the percentage of detractors from promoters.

You can measure almost anything using an NPS score – so as well as understanding the overall NPS for your organisation, you can track scores for everything from individual products, stores, web pages or even staff members.
NPS is an excellent way of understanding the overall customer perception of your brand. You should measure NPS regularly so you can continuously learn and track customer loyalty over time.
For more information on NPS read our guide to Net Promoter Score here.
2. Customer Satisfaction Score (CSAT)
Where NPS measures a customer’s overall perception of a brand, customer satisfaction (CSAT) measures how satisfied a customer is with a specific product, service, or interaction with a brand.
CSAT targets a ‘here and now’ reaction to a specific interaction, product or event, but it is limited when it comes to measuring a customer’s ongoing relationship with a company.
CSAT is measured by one or more variation of this question that usually appears at the end of a customer feedback survey:
“How would you rate your overall satisfaction with the [goods/service] you received?’
Respondents use the following 1 to 5 scale:
- Very unsatisfied
- Unsatisfied
- Neutral
- Satisfied
- Very satisfied
The results can be averaged out to give a Composite Customer Satisfaction Score, although CSAT scores are more usually expressed as a percentage scale: 100% being total customer satisfaction, 0% total customer dissatisfaction.
Brands can gauge customer satisfaction overall by presenting surveys at various customer interaction episodes, asking customers to rate their experience or a specific product. From there, brands have an opportunity to identify problem areas and link them to a particular phase in the customer journey.
3. Customer Effort Score (CES)

Customer Effort Score (CES) measures a customer’s ease of an experience with a company. It’s typically measured by sending customers an automated post-interaction survey asking them to rate a specific statement on a defined scale by asking the question “on a scale of ‘very easy’ to ‘very difficult’, how easy was it to interact with [company name].” The statement will depend on the interaction they just completed.
Companies can then analyze the potential points of friction in the journey. For example, low CES scores might reveal that a website’s checkout process is too complicated. Or that their experience submitting a support ticket was confusing.
By acting on this insight and removing obstacles for the customer, companies can reduce customer service costs and attrition rates (and by extension, loyalty) by making things more convenient for the customer.
Other Customer Experienc Metrics You Should Know
1. Customer Churn Rate

Customer churn describes the rate at which a customer abandons a brand, unsubscribes, or stops visiting a website. You can calculate churn by dividing the total number of customers lost by the total number of active customers over a specific timeframe.
For subscription-based companies, churn is easier to measure than it is with an online store where all items are purchased on a one-off basis. It’s essential for e-commerce brands to define what churn means within the context of their company.
Read our guide on churn analysis here.
2. Retention Rate
Customer retention rate refers to the percentage of customers that the company retains over a specific period. Retention is, in essence, the opposite of churn, meaning gathering feedback from customers who stick with you can reveal what you’re doing well.
3. First Response Time
First response time is the average amount of time that it takes for customers to receive an initial response to a support issue. Generally, this is measured by customer support team, it's calculated by taking the average response rate time between a customer opening a support ticket and when a rep acknowledges their request.
4. Average Handling Time
Average handling time is the amount of time to resolve a support issue from start to finish. This includes every interaction from calls to emails and chat, plus time spent waiting between interactions. The “ideal” handling time varies by organization and complexity of the issue, but it’s good to get a sense of how long people are waiting, on average, for a fix. Remember, this could be a root cause for churn.
How to Understand "The Why" Behind Your Customer Experience Metrics
How can you turn survey results into action?
Customer feedback holds all the answers. Countless businesses fail to extract actionable insights from the large amount of unstructured data they collect.
When trying to deliver a customer experience that your competitors can't match, focusing on quantitative metrics alone is a huge opportunity missed for customer experience practitioners.
Collecting quantitative data is essential to benchmark customer experience performance over time, but acting on quantitative metrics is ill-advised without understanding the why behind the score.
Your customer experience data needs to be actionable enough to change engineering and product roadmaps across an organisation. You should be able to understand whether a potential change in product strategy will meet the needs of a specific customer segment.
To get to the why behind the score, you need to capture open-ended feedback from customers. Open-ended feedback will help you evaluate why your NPS or CSAT is going up or going down.
Customer feedback is a great way to build a continuous improvement feedback loop. Encourages employee learnings and behavioural change throughout an organisation to make it more customer-centric.
Today, touchpoints—and data sources—have multiplied exponentially to include mobile apps, call centres, kiosks, all kinds of social media, and pretty much anytime anyone ever interacts with a screen. It's possible to capture customer feedback across multiple sections of the customer journey targeting different customer segments on various channels.
When surveying, ask customers what they think, in their own words, and make it easy for them to share. The quality of insights gathered is dependant on the quality of data captured. It's essential to ask the right questions at the right time to the correct customers. Download our guide on survey design and creation here.
Once you have the feedback data, it's time analyse and extract insights that will move the needle. Your analysis will provide clear actions on where to focus efforts to improve your customer experience.
1. Customer Experience Analytics
Which handful of actions will generate the most impact on the customer's experience?
Customer experience improvement initiatives can comprise of multiple uncoordinated plans that emerge with good intent from different parts of an organisation. The problem is that there is little clarity which action will offer the most value for customers.
Optimising customer experiences means understanding all the possible combinations of sequential interactions that a customer can take and identifying opportunities for improvement.
To identify opportunities for improvement, you need to understand how your customer's think and feel. Imagine if you had insight into the mind of the customer? You could quickly enhance your marketing messaging, product roadmap and support experiences.
However, the challenge of breaking down the mountain of feedback across multiple data sources can make even the most hardened executive shudder with fear. Companies today have numerous systems, databases and tools siloed across different functions all geared towards collecting feedback. Teams are sitting on colossal data sources of customer feedback, failing to take advantage of the opportunity it presents.
Analysing these large data sets and providing insights and recommendations has, for a long time, been a headache for customer experience practitioners. But it doesn't have to be hard. You can break down this complex problem into a simple process by integrating different data sources of customer experience data into one platform.
Okay, so you may be thinking that this is all well and good, but how do I get across the page?
Read on.
2. Integrate data silos into one platform
What may appear as a monumental task is quite simple, and it's a problem that can be easily taken care of with the right tools. A modern customer experience platform powered by the latest in Text Analytics and Deep Learning, empowers you to integrate all your feedback channels and analyse your data at scale in real time.
What does that mean exactly? You can now identify topic and sentiment in each piece of customer feedback with the same level of detail as you and I reading this text right now. Breaking down that information into clear insights, so you understand the key drivers behind your customer experience metrics. Ensuring you have actionable insights to shape decision making and build experiences that delight.
For instance, a bank could identify significant detraction causes include poor app security and unintuitive UI. On the upside, the variables that turn customers into promoters include helpful support and ease of use on the app. We can then dive deeper into topics such as app security and identify sub-topics such as login, auto log-out and verification/identification. Helping you uncover the killer insights not possible to spot with the human eye that can help enhance your customer experience.
Must-win battles in the banking industry, thus often involve creating a seamless UI and improving customer pain points such as app security and contact centre accessibility. Identifying topics that matter most to customers can help improve aspects of the customer experience that you wouldn’t have had visibility without the help of text analytics.The more data we have, the more granular insights we extract.
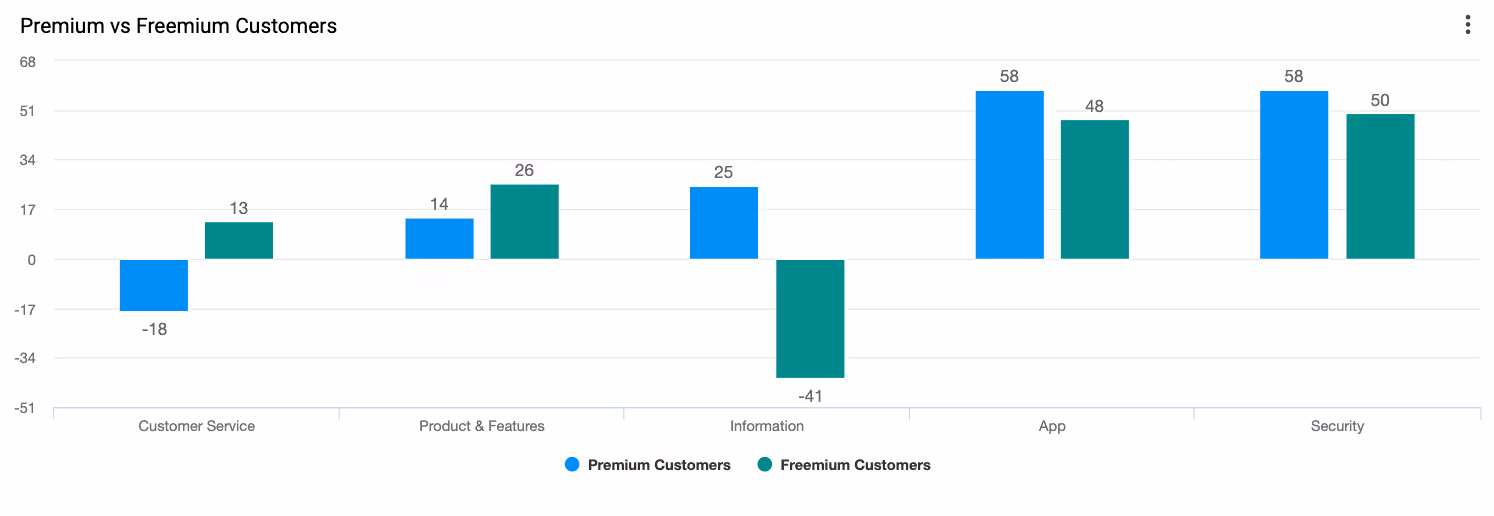
Combined with other sources of customer data, you can perform effective customer segmentation. Segmentation adds a lot of context to customer data so you can better understand how different customer groups feel about some very prominent parts of the customer journey.
You may have different competitors challenging you for different customer segments in different markets. If you could segment how different customer groups such as 16-25 think and feel you can begin to build personalised customer experiences and delight customers.
Hopefully by now you're imagining the possibilities that lie at your fingertips and the quickest and easiest way to find out what our platform can do for you is book a demo and put it to the test on your data.
3. Monitor customer experience metrics in real time using dashboards
Customer experience teams need to share detailed reports on metrics both at a journey-level and at an overall level.
Create custom dashboards for different teams so they can keep track all of the feedback relating to their area of responsibility - by product, by marketing, by customer care team or agent etc. View an example dashboard here.
Custom dashboards can help multiple teams operate more collaboratively. A dashboard will be able to explain to the rest of the business the relative impact of solving a problem or making a change to the customer experience in a way that is understandable to multiple stakeholders. Set up alerts, so the right team member is notified when there is a change in the data that require recognition.
At Chattermill, we’ve noticed that the more employees who have access to Voice of the Customer, the higher the company-wide motivation to improve customer experience. This is because employees can access insights and can track and measure the fruits of their labour, specific to their role or function.
Customer Experience Metrics: FAQs
What are customer experience metrics?
Customer experience metrics are measurements used to evaluate how customers perceive their interactions with a brand. They provide insights into satisfaction, loyalty, and overall experience quality.
Why are customer experience metrics important?
They help businesses track performance, identify areas for improvement, and measure the success of customer experience initiatives. Strong metrics indicate higher loyalty and long-term growth potential.
What are the most common customer experience metrics?
The most widely used metrics include:
- Net Promoter Score (NPS): Measures likelihood to recommend.
- Customer Satisfaction Score (CSAT): Measures satisfaction with a specific interaction.
- Customer Effort Score (CES): Measures ease of completing an interaction.
Other useful indicators include churn rate, retention rate, and customer lifetime value (CLV).
How do businesses measure customer experience metrics?
Companies use surveys, feedback forms, and behavioral data to track these metrics. Combining quantitative scores with qualitative feedback provides a more complete picture of customer experience.
How often should customer experience metrics be tracked?
Metrics should be tracked continuously, with surveys deployed at key touchpoints and periodic reviews conducted to monitor long-term trends.
How do customer experience metrics impact business performance?
Improved metrics lead to stronger loyalty, reduced churn, and higher customer lifetime value. Poor scores can highlight pain points that, if unaddressed, may harm growth.
What role does technology play in tracking metrics?
Technology enables real-time surveys, automated data collection, and advanced analytics. AI tools can also analyze unstructured feedback and detect sentiment at scale.
How can businesses improve customer experience metrics?
By listening to feedback, addressing recurring issues, personalizing interactions, and ensuring consistency across touchpoints, businesses can steadily improve their customer experience scores.