Building Your Own Feedback Analytics In House? Read This First.

.avif)

The CX intelligence
platform that's AI-native by design
Book a demoIf your company has a strong product-led culture, a tech-driven mindset, and a skilled engineering team, it makes sense that you’d consider building your own feedback analysis solution, instead of buying one.
At first glance, it seems like a great idea - giving you more control over your data, avoiding vendor lock-in, and potentially saving costs while allowing for greater customization. But on the flip side, you also want to avoid cost overruns, shifting requirements, endless delays, and a project that takes valuable time away from your team’s core work.
According to McKinsey, large custom-built IT projects typically exceed budgets by 45%, run 7% over schedule, and deliver 56% less value than expected. To help you navigate these challenges, we’ve created a guide to walk you through the key factors to consider before investing in an in-house build.

In this guide, you’ll learn:
- What’s required to integrate with your feedback sources
- How to prepare your data for high-quality insights
- Common pitfalls to avoid when building a taxonomy
- What it takes to build a scalable infrastructure
- Key reporting capabilities you’ll need
- How to plan for long-term maintenance and support
- What are the hidden costs of building in-house
These insights come from experts - both internal and external - who have spent years developing AI-powered feedback analytics solutions and working with hundreds of companies. We’ll share their best practices so you can plan with confidence. Let’s dive in!
Data Integrations
Building your own solution starts with ingesting data from various sources into a unified system.
If you're working with a single source of customer feedback, such as AppStore or Google reviews, the effort is manageable. However, combining data from multiple channels - like surveys, reviews, support tickets, or chat logs - will require building and maintaining custom integrations for each source.
Things you need to consider:
- APIs and Integrations: If you're considering building integrations using various APIs, be prepared for months of development work. The complexity can vary based on the availability of APIs, the structure of the data, and the number of systems you need to connect. It's something you’ll need to plan for early on.
- CSV Exports: From our experience, relying on manual data imports, like CSV exports, often means working with outdated data. These imports are also prone to errors, time-consuming, and hard to scale.
- Metadata Enrichment: Enriching your feedback with metadata like customer ID, NPS, or CSAT scores can add context and make your analysis more valuable. Keep in mind that your users will likely use this metadata to filter reports, so it's crucial to build this into your solution from the start.
- Complexity of Data Sources: Don’t forget that certain types of CX data, particularly voice and video conversations, may require complex data pipelines and expensive storage.
Data Quality and Cleansing
To ensure high-quality analysis, ingested data must first be cleaned, structured, and transformed into a format that machine learning models can process. This involves eliminating noise, standardizing inconsistent data, and aligning different data sources to ensure consistency.
Things you need to consider:
- Translations: Consider how you'll handle feedback in multiple languages. To ensure unified analysis, you'll need a system that can accurately detect and translate feedback.
- Transcription: Key sources of CX data might not be easily analyzed until they are transcribed. An example would be contact center conversations, which would typically require high-quality transcription to be useful for analysis.
- Unifying Data Formats: Standardizing data from various sources into a single, consistent schema is essential for reliable analysis. Without this, you risk inconsistencies that can skew your results and make it harder to draw conclusions.
- Noise Removal: Make sure your solution can filter out irrelevant or low-value data (like spam or off-topic comments). This ensures you're only analyzing the feedback that provides actionable insights.
- Duplicate Entries: Pay attention to duplicate entries, especially when data is ingested incrementally. An effective solution should be able to identify and remove these duplicates automatically.
- PII Anonymization: Always consider how to handle personally identifiable information (PII). Ensure that sensitive data, like phone numbers or credit card details, are anonymized or removed when necessary.
Building a Robust Taxonomy
Building a taxonomy means creating a structured system to classify feedback into relevant groups that reflect common topics or concerns that are robust and cover different areas of your business. The goal is to organize feedback into categories and themes that allow you to quickly identify trends and key insights.
Things you need to consider:
- Creating Taxonomy with Generative AI: When using LLMs to create a taxonomy, be aware that they often produce outputs that are generic or inconsistent, missing the necessary nuance for detailed feedback analysis. These models are also limited by token windows, meaning only a portion of the data can be processed at a time. Finally, building a reliable taxonomy requires domain expertise, precision, and context - areas where LLMs alone may not suffice.
- Achieving the Right Level of Detail: When building your taxonomy, be prepared that users will eventually need even more granular insights, and your initial categorization system may be too generic. To uncover precise insights, your team will need to create multiple layers of themes over time, and manual efforts alone won’t scale to meet these demands. While precision is important, it's not always helpful to analyze data at the most detailed level. You want to analyze similar issues together to understand the relative performance of different parts of your business. In practice, this means a taxonomy has to have multiple levels of specificity.
- Clustering Similar Concepts: Clustering is a complex process of grouping similar pieces of feedback together to identify patterns, themes, or insights. Since unstructured data is often highly contextual, determining whether pieces of feedback are related or not isn’t always easy. Misclassification can lead to inaccurate insights, which can significantly impact decision-making. Unfortunately, even with recent breakthroughs in AI, clustering remains hard to get right.
- Maintaining a Taxonomy Over Time: Taxonomy management becomes more difficult as new themes emerge. While smaller organizations may manage this easily, growing businesses may struggle to keep their taxonomy updated and accurate as new themes emerge.
Building and Scaling Infrastructure
When building the infrastructure for an internal feedback analytics tool, selecting and maintaining backend systems, servers, and database solutions is critical for ensuring the tool can handle large volumes of data efficiently and reliably.
Things you need to consider:
- High Volumes of Feedback: As feedback data grows quickly, especially in large organizations, make sure your ingestion pipeline can scale effectively to handle high volumes without creating bottlenecks.
- Ongoing Maintenance: Remember that building the system is just the beginning. Continuous maintenance is crucial to ensure that your system remains reliable, secure, and adaptable to evolving requirements.
UI and Reporting Capabilities
Once feedback is processed, tagged, and analyzed, the next step is to visualize the data clearly and impactfully. Tools like Tableau, Looker, and PowerBI can help transform complex data into actionable insights, but the real challenge lies in ensuring that decision-makers can easily access and use these tools effectively.
Things you need to consider:
- User Experience: When using external tools for data visualizations, reports, and dashboards, make sure they are user-friendly and accessible to everyone, including non-technical team members. The ability for all users to easily create, interpret, and access these resources is crucial for successful adoption.
- Customization: To extract meaningful insights, your visual reports should allow advanced segmentation and filtering. This enables users to slice and dice the data across different parameters, making it easier to meet specific business needs.
- Visualizing Unstructured Data: When working with unstructured data, such as text feedback, remember that a graph alone isn’t enough. Always support data points with relevant customer quotes or context to ensure users can fully understand the insights.
- Sharing Insights: Don’t just focus on visualizing the data - ensure your tool can also share insights effectively. Look for solutions that automatically distribute insights to stakeholders or integrate with platforms like Slack, Jira, or Notion to support collaboration and timely action.
- Alerting: Ensure your solution includes an alerting system that detects anomalies in feedback data and triggers notifications for important events. This functionality is crucial for helping your teams stay on top of emerging risks before they escalate.

Maintenance and Continuous Support
Beyond time to value, maintaining an internal feedback analytics solution can be difficult long-term for a variety of reasons.
Things you need to consider:
- Distraction from Core Tasks: Building and maintaining an in-house solution creates a heavy reliance on the internal team, diverting their focus from core competencies and strategic priorities.
- Ongoing Costs and Resource Allocation: In-house projects require substantial upfront investment, including salaries for engineers and infrastructure costs. The overall cost can quickly escalate as additional resources and time are needed throughout development.
- Employee Turnover: If the experts who created the solution leave, how easily can new employees maintain and work on the custom-built system?
- Technology Updates: As your technology evolves, you may need to update data models, reports, and taxonomy. In addition, changes in vendor APIs will require someone to manage and update the system regularly.
The Hidden Costs of Building In-House
If cost savings are your main reason for building in-house, it’s worth taking a closer look.
The true costs typically fall into three categories: initial setup, ongoing maintenance, and the infrastructure needed for reporting and visualizations.
While the exact budget will depend on the scope and complexity of your project, there are ways to estimate the investment required. Here’s how to calculate it for your organization.
INITIAL SETUP COSTS
The initial setup costs of an internal build largely depend on the engineering resources required and the time needed to develop the solution.
To estimate the investment, start by defining the project scope, assessing the resources needed, and calculating the time required to bring it to life.
Even with a lean approach, your MVP will likely require at least three engineers and 3–4 months to build. Considering average engineering salaries, that alone translates to a significant cost—before factoring in the impact of pulling your team away from core projects. And that’s just the starting point.
Note: The cost for each team member was estimated using the average national salary data from Glassdoor for a Backend Engineer - $111K.

RUNNING COSTS
The cost of building an internal tool goes beyond development. You'll need to account for data processing services to ingest, store, and query large datasets (Google Cloud pricing can provide estimates) and the cost of analyzing data with LLMs (see OpenAI pricing). While these services are more affordable than ever, maintaining an internal tool still requires ongoing engineering effort, adding to the overall costs.
Note: Team costs are based on Glassdoor's average Backend Engineer salary: MVP (1 engineer, 2 days/month), Expanded (2 engineers, 3 days/month), Robust (3 engineers, 4 days/month).

VISUALIZATION TOOL COSTS
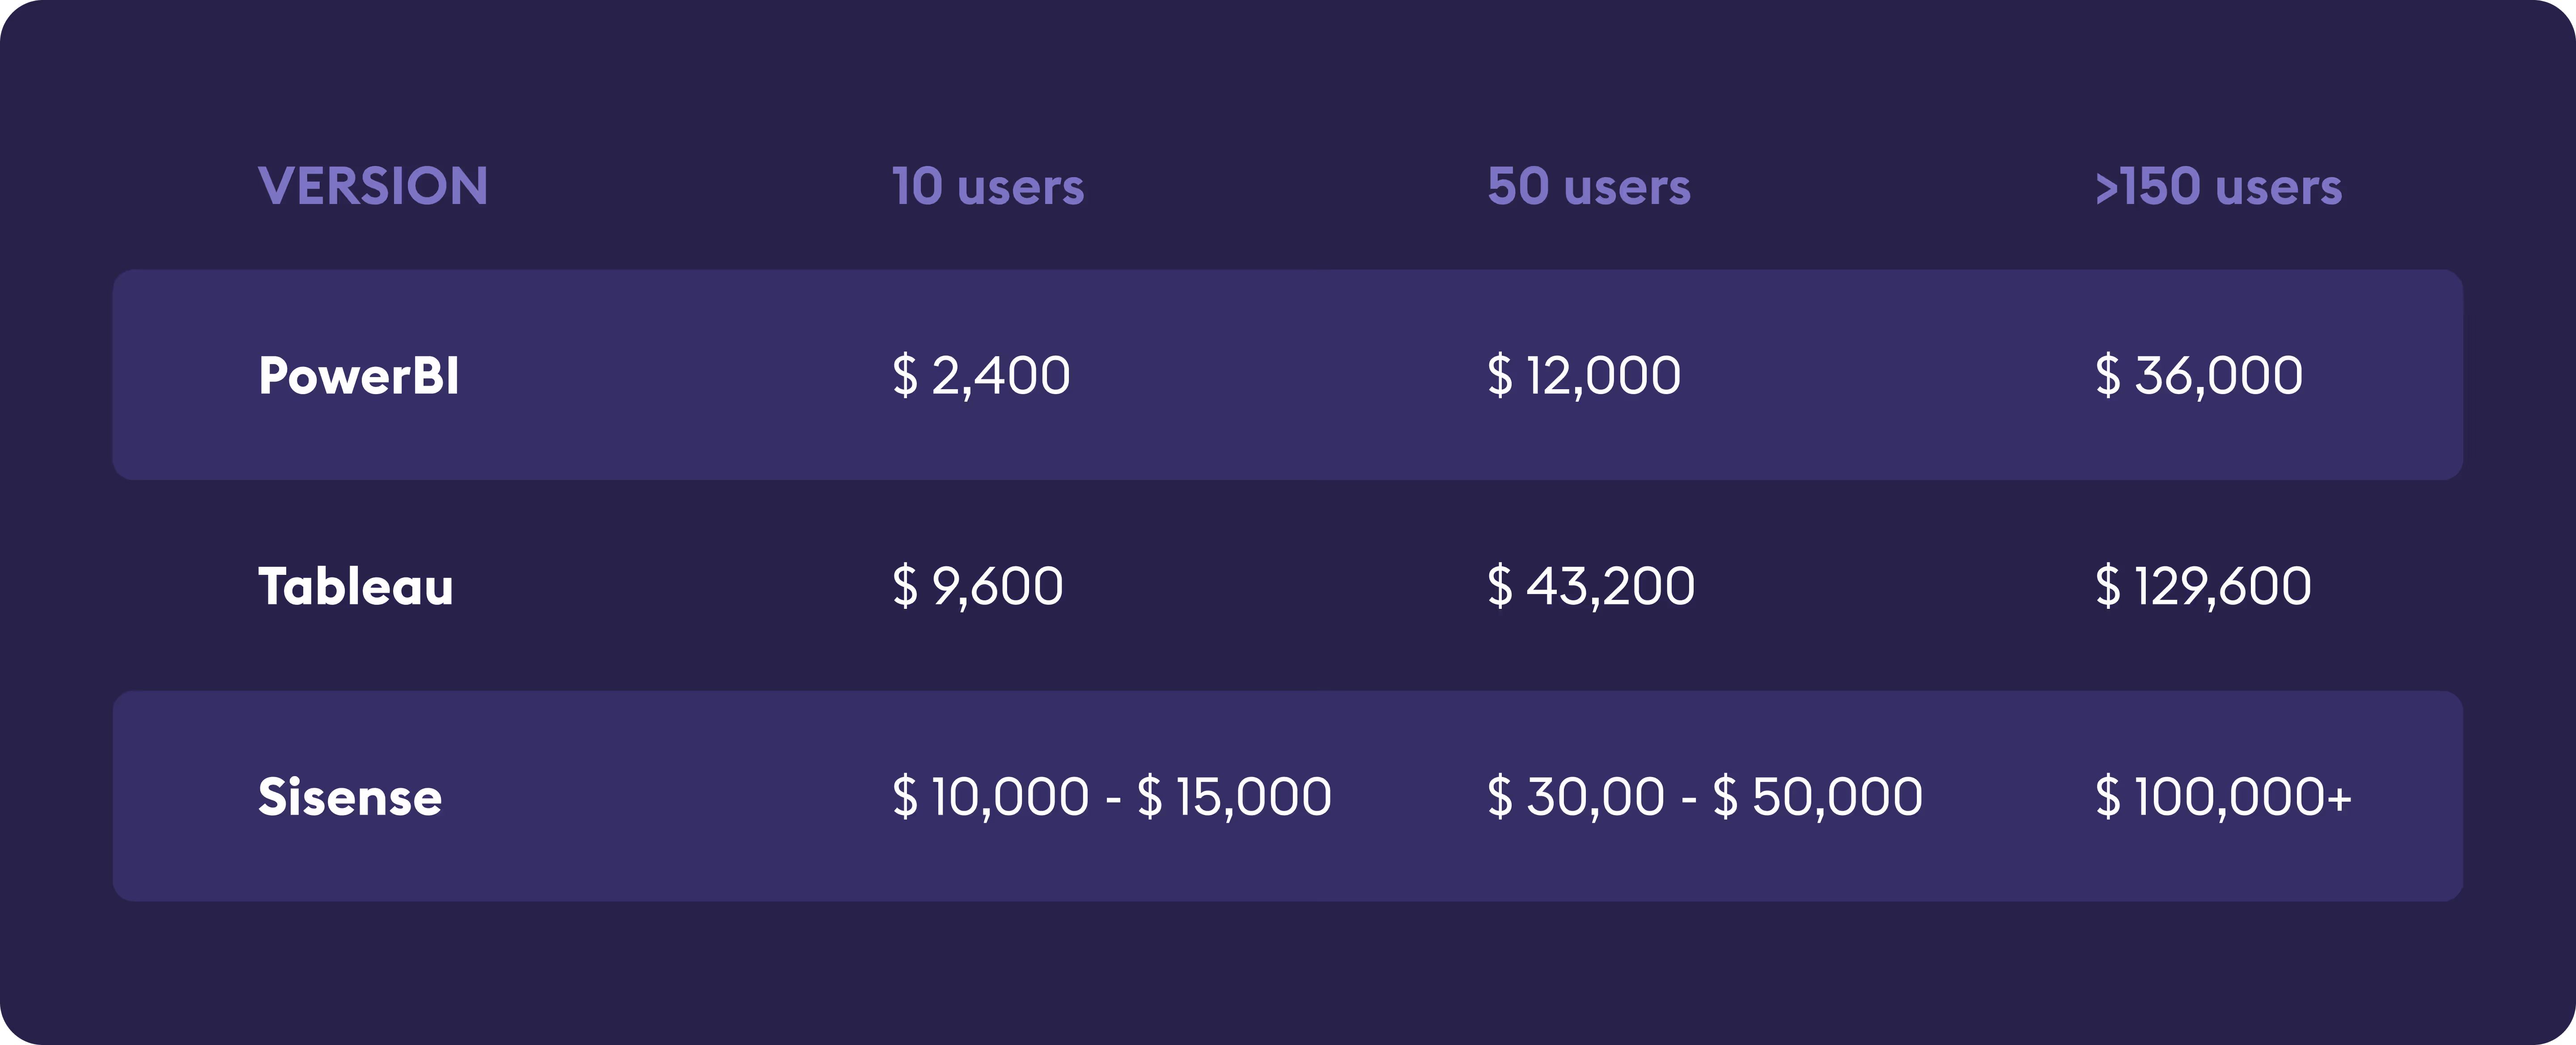
Finally, when building an internal tool, companies must consider how non-technical teams will access and use the data. Reports, dashboards, and insight-sharing are essential for decision-making across departments. While BI and data visualization tools can help, they often come with high costs, typically charging per user.
Note: See PowerBi pricing and Tableau pricing for reference. Sisense estimations are based on publicly available sources: AWS Marketplace, Reddit, and Holistics.
Should you Build or Buy?
In short, building feedback analytics that can process hundreds of millions - or even billions - of customer interactions is a complex, expensive, and resource-intensive project.
There are many nuances to plan for, and the process can take months, requiring significant engineering effort. Along the way, you risk unexpected delays, cost overruns, lack of internal alignment, and a solution that delivers less value than anticipated.
The good news? You don’t have to give up the benefits you expected from building in-house. Off-the-shelf solutions can offer advanced customization, robust data security, cost savings, and access to industry expertise - without the complexity of building from scratch.
To make the right choice for your organization, explore why companies consider build vs. buy and the benefits of each approach.
Curious to see Chattermill's advanced feedback analytics in action? Book a demo today.

CX intelligence
for teams and agents
Book a meeting


COMPARISONS
Chattermill Analytics Limited
68 Hanbury St, London, E1 5JL,
United Kingdom