Last month, we rolled out an all-new design to our reports screen, updating your home of analysis with a new look and feel. Today, we’re building upon this with a new functionality called multiple breakdowns, designed to give you more precise, three-dimensional insights from your data.
Our goal with these updates is simple - to give you the flexibility to compare different data points and instantly explore the relationships between different factors.
We know that most analytics tools aren’t designed for the typical non-technical user. They’re awry with clunky interfaces and unexplained jargon, and often stop you in your insight-finding tracks before true inspiration can strike.
Conversely, once you’ve got to grips with how a platform works, to find truly valuable insights you need to tailor the analysis to your own organization. Often ready-made, one-dimensional reports just don’t cut it.
Our updated reports are designed with a fresh UI that is easy to navigate, whilst multiple breakdowns helps tailor your analysis to compare whichever factors are most relevant to you, so you can find nuanced insights that drive retention.
Find precision insights in your data
The best insights are those that are highly specific to your data. The more precisely you can identify the source of an issue in your feedback, the greater the chance that any action you take will have a meaningful impact.
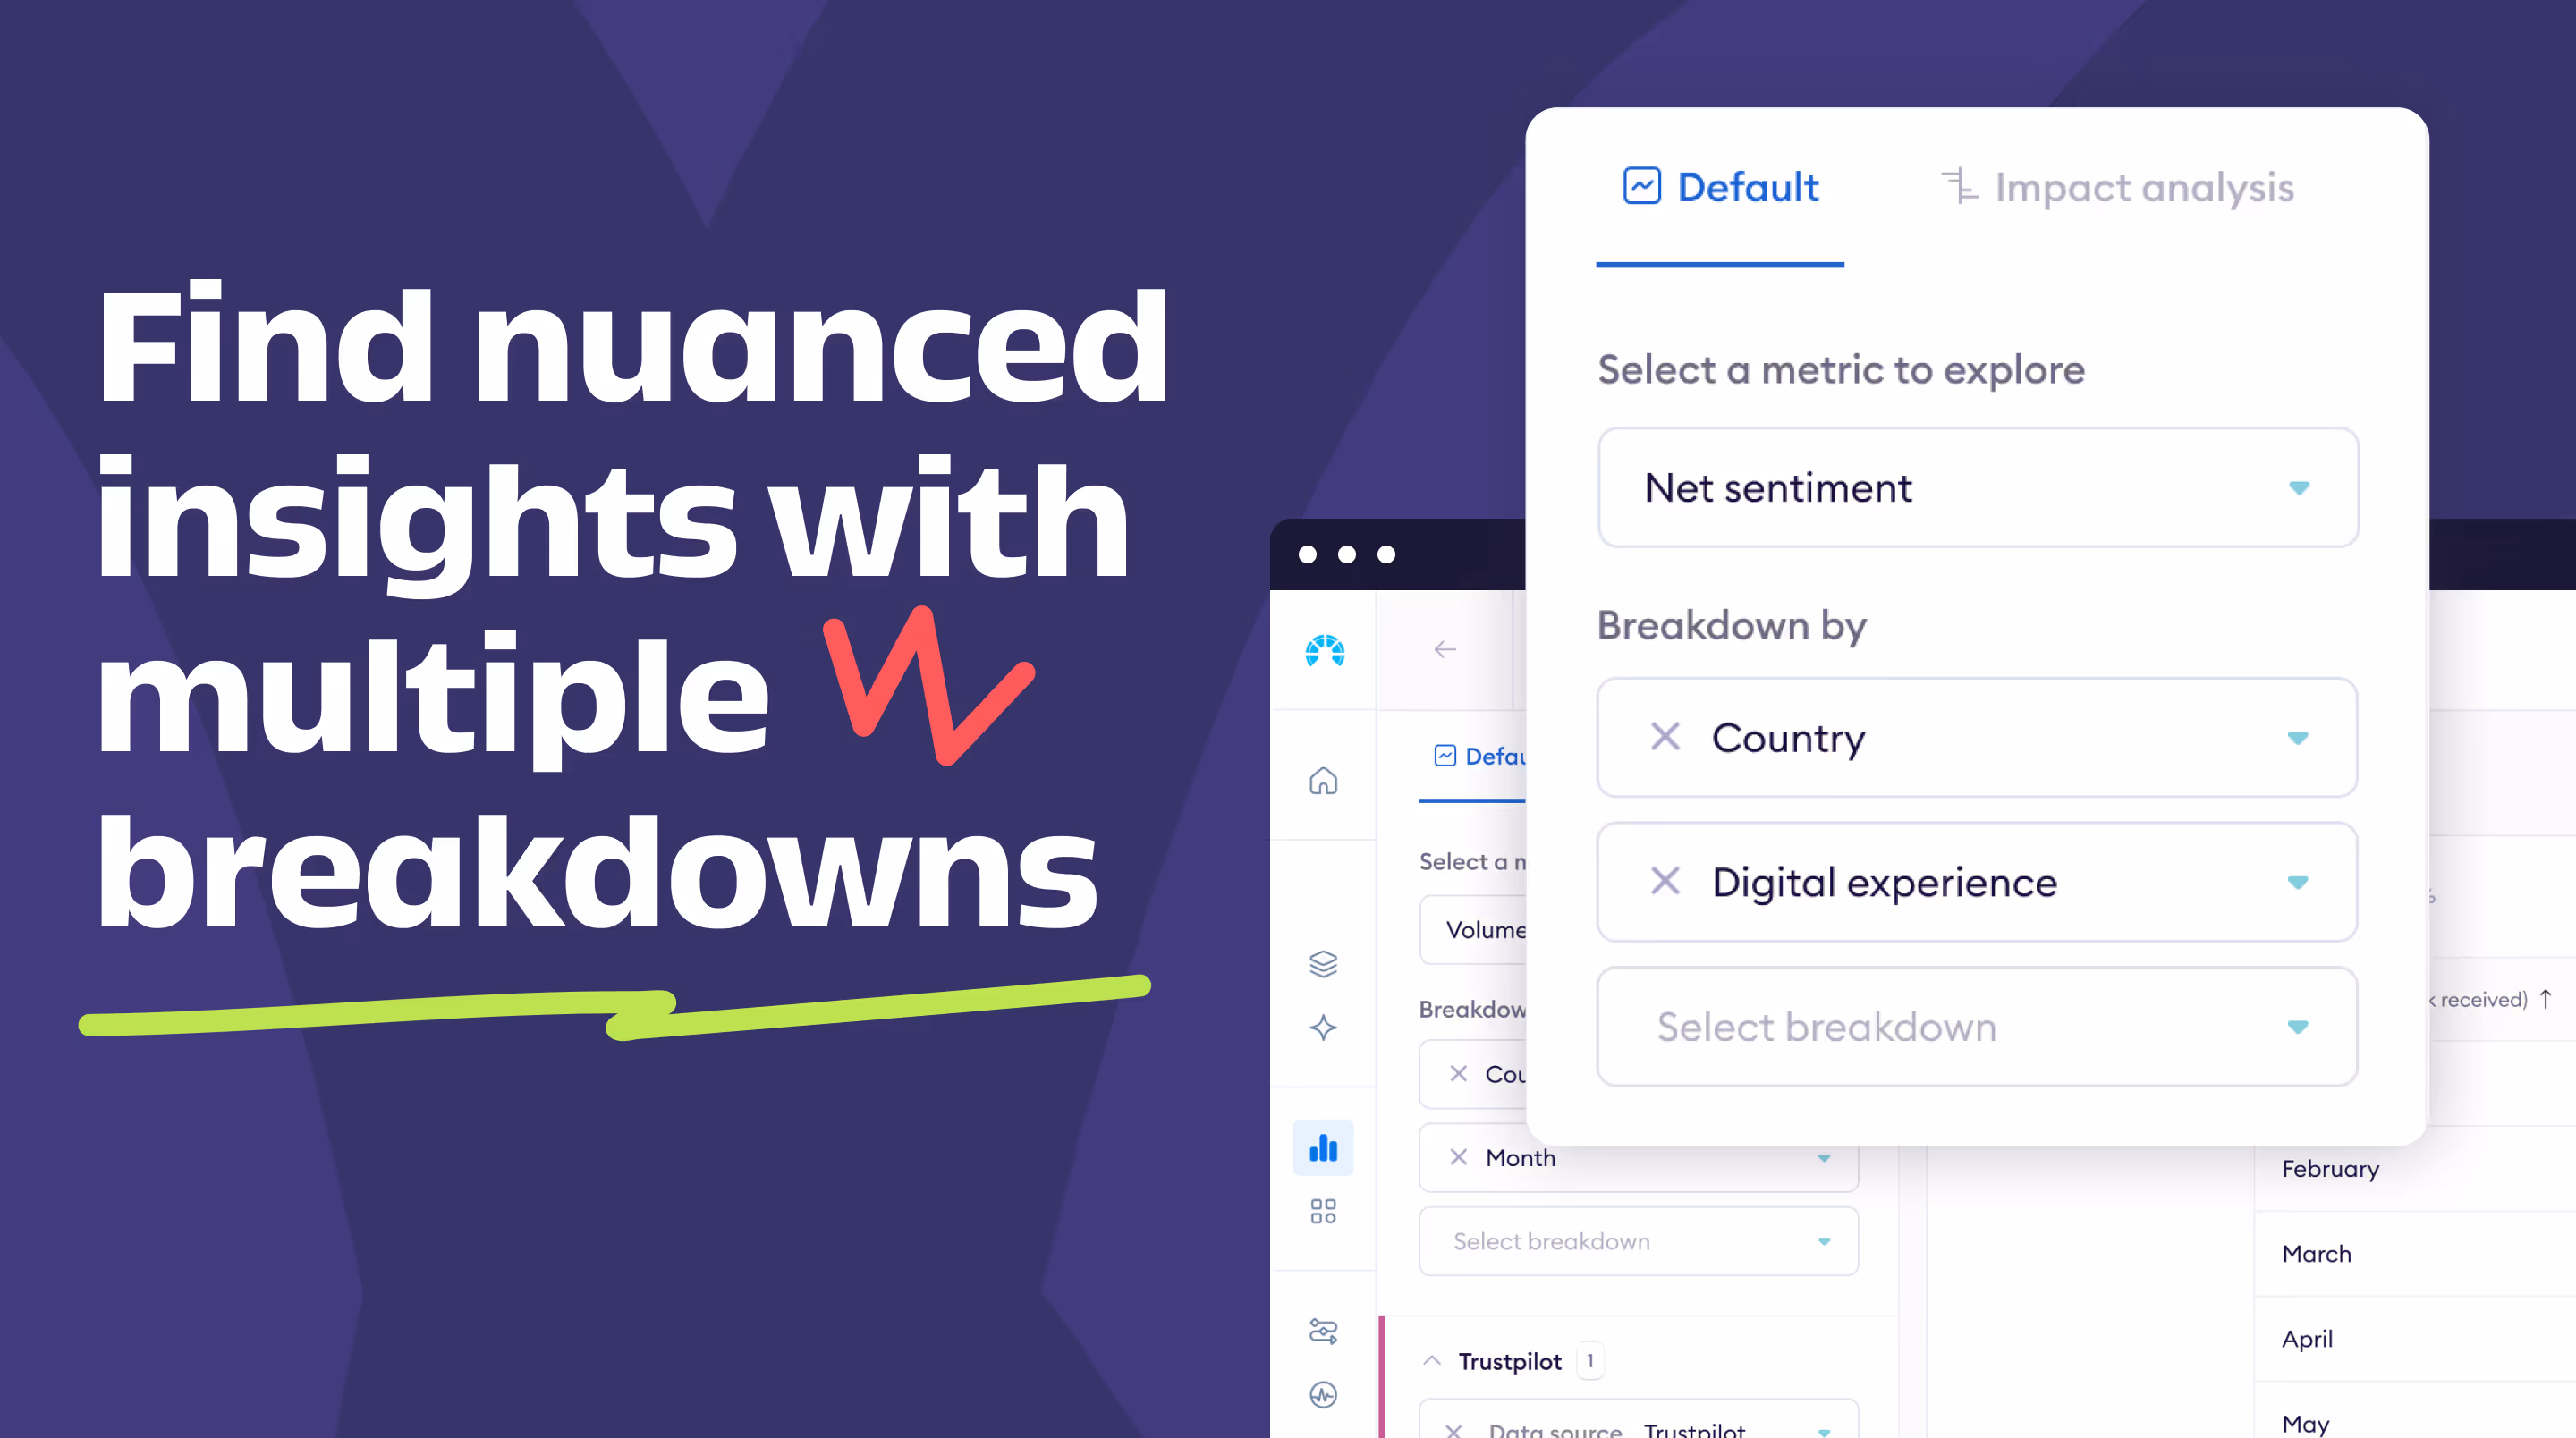
Multiple breakdowns have been added to empower all of our users to find insights with this level of granularity. By allowing you to compare up to three dimensions at the same time, multiple breakdowns helps you uncover complex patterns and connections across different factors, and puts more informed, actionable insights in the hands of your team.
Chattermill now lets you organize your data using up to three layers of segmentation, instead of just one. So, rather than viewing a report that only shows how one segment - like customer group - performs against a specific metric, you can also dive deeper and see how particular themes are performing within that segment.
You can apply this to any available metadata, whether it’s city, agent name, data source, or any other available variable. This multi-layered analysis is currently available exclusively in the table view, and opens the door to a range of highly specific insights that are endlessly tailorable to your organization.
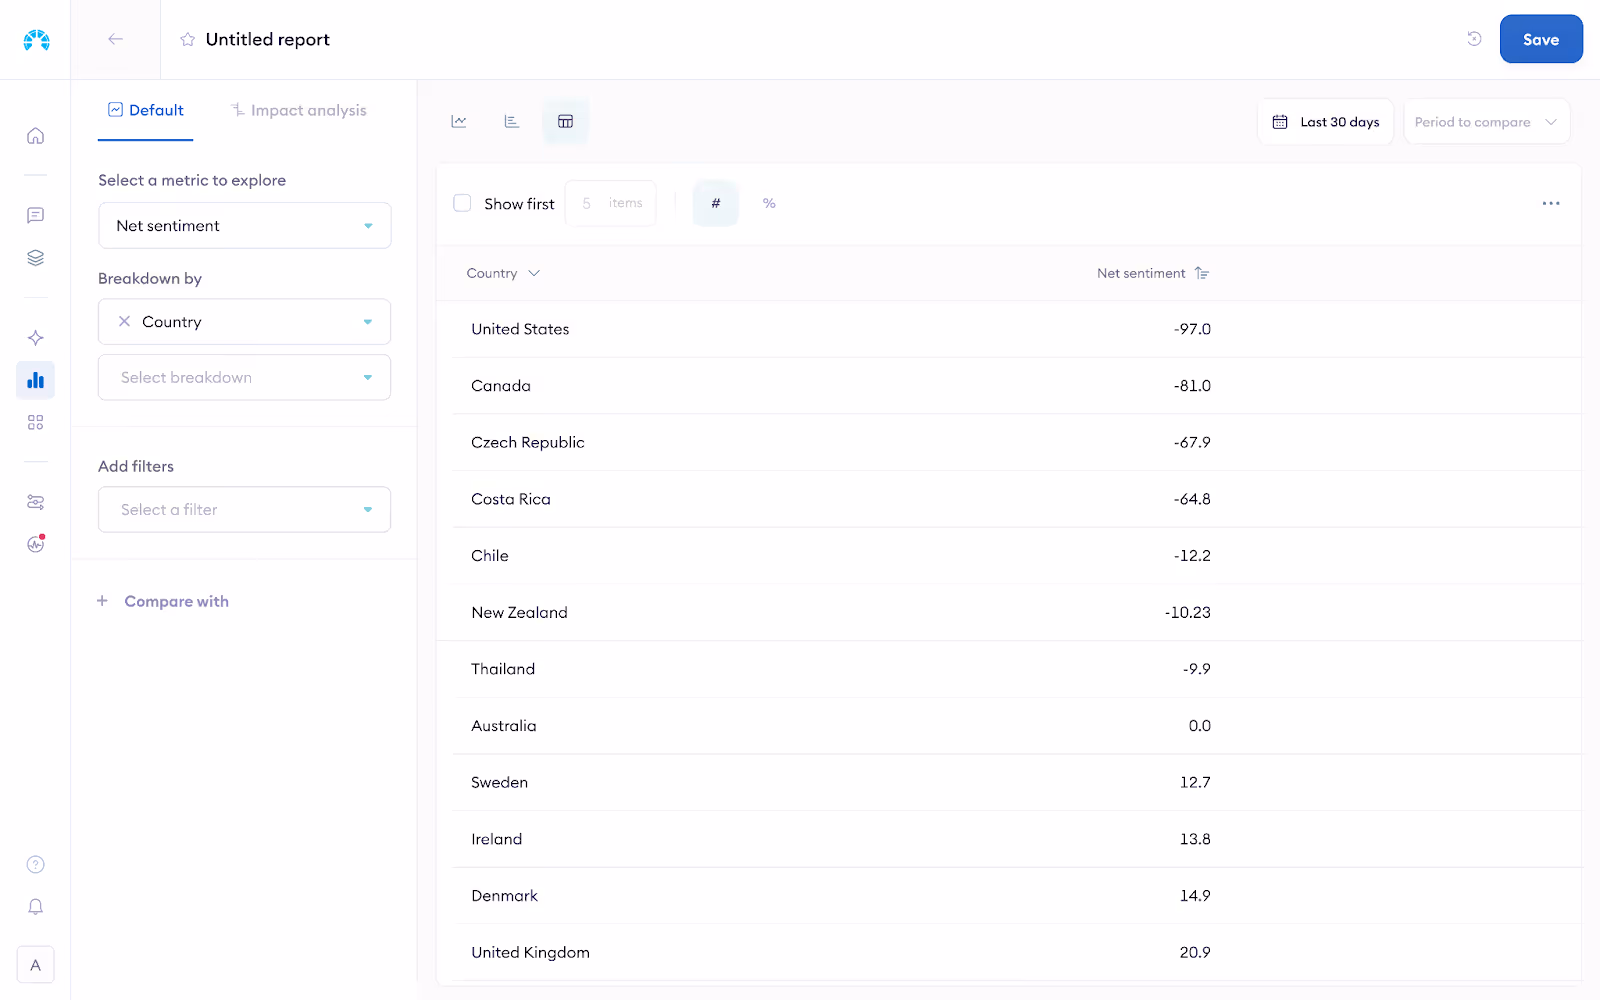
For example, if you’re the Head of CX overseeing a chain of in-store locations across the country, you might want to compare how different regions are performing in terms of net sentiment. To start, you’d choose net sentiment as your metric and group the data by region. This high-level view provides a broad snapshot of how well each area is performing in terms of customer satisfaction. For instance, you might notice that your stores in the South are performing quite well, while those in the Midwest are lagging behind.
However, this doesn’t provide the complete picture. Within those regions, individual stores may vary in performance, and a low score in one region could be driven by a single underperforming store rather than a widespread issue.
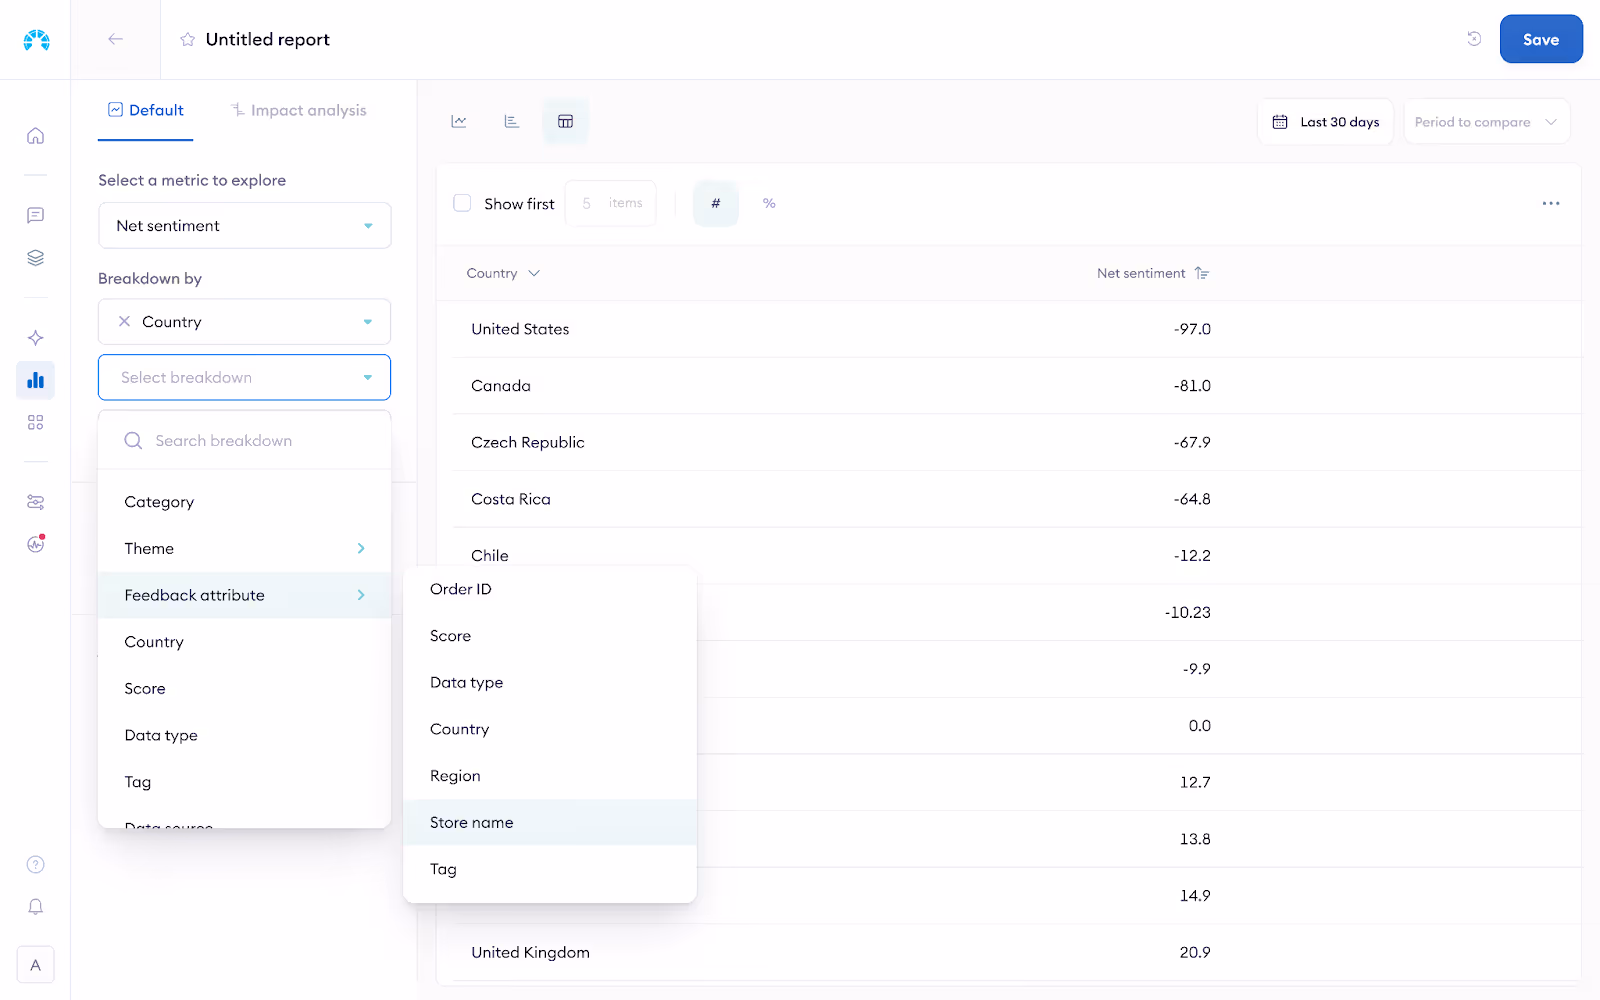
With multiple breakdowns, you can add a second breakdown to focus on specific stores within each region. The new table view now shows both breakdowns within one another, so you can easily compare how individual factors are performing relative to their wider whole, all at a glance. By doing this, you might discover that one or two outlier stores in the Midwest are significantly dragging down the region’s overall net sentiment. These stores may have recurring issues—perhaps long wait times or frequent products that are out of stock —that are negatively affecting the customer experience.
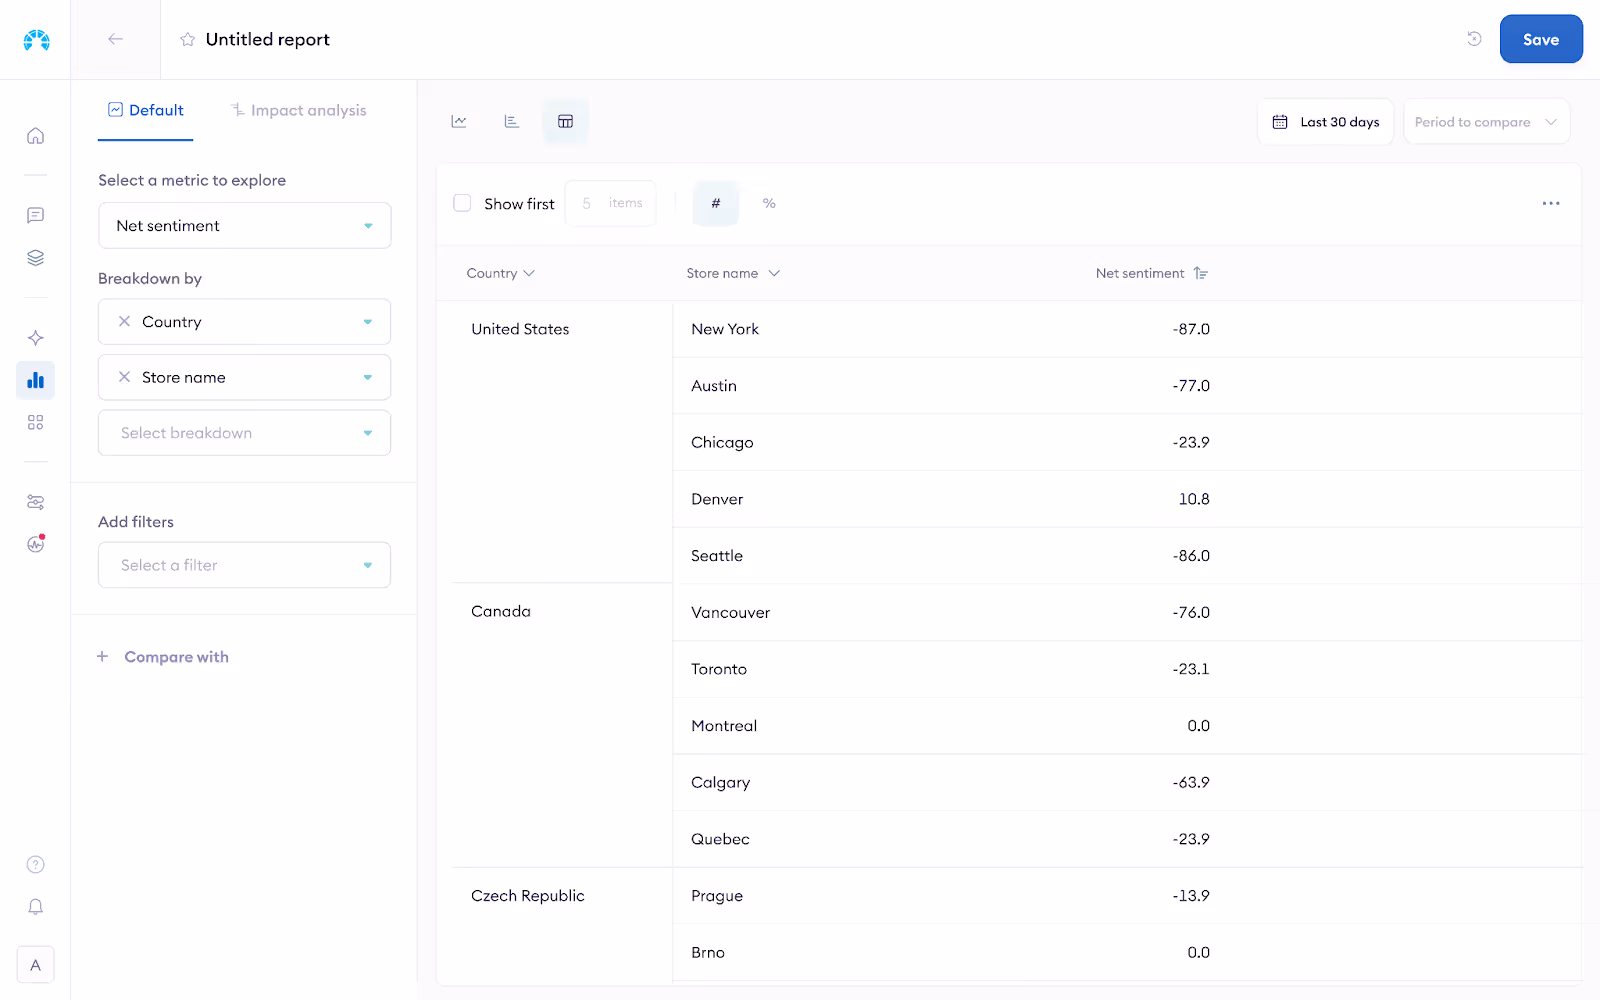
By drilling into this level of detail, you can target your improvements more precisely. Instead of launching broad regional initiatives to improve sentiment, you can focus your efforts on the specific stores that are driving the negative feedback. This could involve retraining staff, updating store layouts, or even reviewing management practices at those locations.
Make smarter, data-driven decisions
One of the greatest advantages of the multiple breakdowns feature is its flexibility, allowing you to tailor your analysis to what matters most for your business. Simply adjust the segmentation based on the factors - whether location, theme, survey type - you name it - that are most relevant to your needs. Here are a few examples of how teams can leverage multiple breakdowns to uncover deeper insights from their data.
Contact Centre
Imagine you’re managing a contact center and want to compare how each team is performing. A single breakdown, such as comparing the net sentiment score against ‘contact team,’ would provide a general overview of team performance. But if you want to dive deeper and understand which agents within those teams are excelling or falling behind, multiple breakdowns can help.
By adding a second breakdown, eg. ‘Agent,’ from the sidebar, you can view how individual agents are performing within their respective teams. This gives you a clearer picture of what’s behind each team’s performance, and enables you to address performance discrepancies or highlight top performers more effectively.
Product Teams
For product teams, gaining insights into how different versions of software are performing across various regions is crucial. With the tertiary level of analysis, this feature becomes especially powerful in uncovering specific trends or issues tied to particular product versions.
Product teams can segment their data by theme, location or demographic, and then product release version, allowing them to track how software updates are impacting different user groups or geographic areas. This level of detail helps pinpoint specific issues within regions and releases, enabling product teams to make more informed decisions and prioritize updates or fixes where they’re needed most.
Empower anyone in your team with analysis
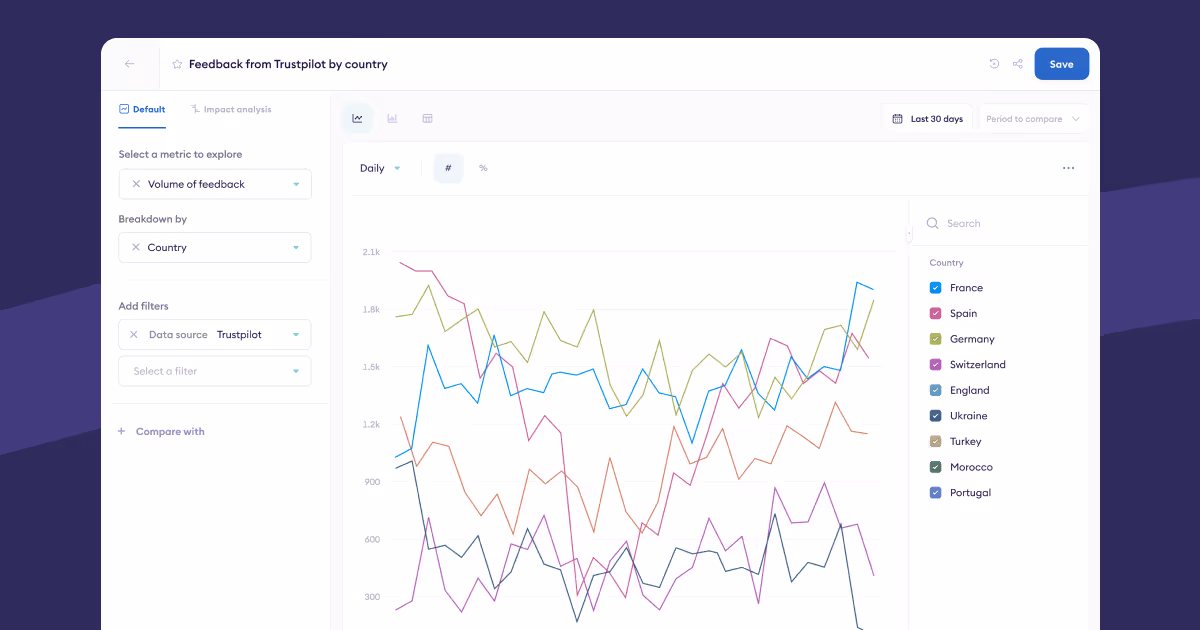
We’ve also updated reports with a refreshed design and more user-friendly experience. They’re now easier to use and understand, with one tab for building a report in a single flow.
From the left-hand sidebar, you can now access all of the selections needed to break down your data. This includes:
- The report type,
- the metric being analyzed,
- breakdowns,
- and any filters & comparison groups
The time comparison window has also been moved to the right-hand side of the reports view for easier access. You can log into Chattermill to start using the new reports view today.
Get started
Multiple breakdowns and new reports are now available for all Chattermill users. If you need any assistance in setting up multiple breakdowns for your account, please contact your Customer Success Manager for support. For more details, visit our documentation.
See how multi-dimensional insights can transform your CX strategy - book a demo today.