Coding Qualitative Data: A Beginner’S How To + Examples


The CX intelligence
platform that's AI-native by design
Book a demoWhen gathering feedback, whether it’s from surveys, online reviews, or social mentions, the most valuable insights usually come from free-form or open-ended responses.
Though these types of responses allow for more detailed feedback, they are also difficult to measure and analyse on a large scale. Coding qualitative data allows you to transform these unique responses into quantitative metrics that can be compared to the rest of your data set.
Read on to learn about this process.
What is Qualitative Data Coding?
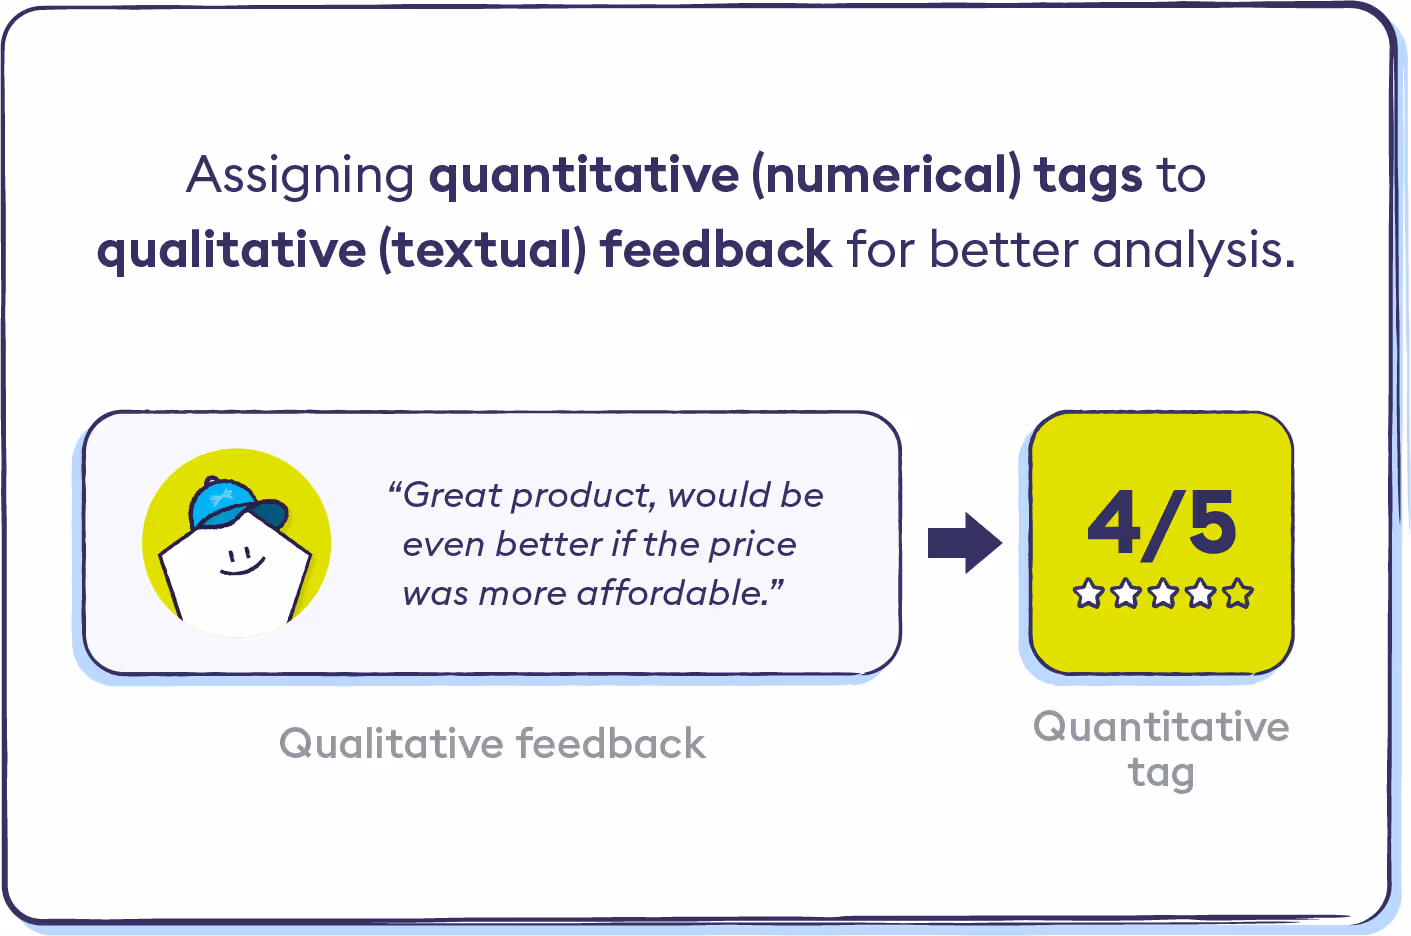
Qualitative data coding is the process of assigning quantitative tags to the pieces of data. This is necessary for any type of large-scale analysis because you 1) need to have a consistent way to compare and contrast each piece of qualitative data, and 2) will be able to use tools like Excel and Google Sheets to manipulate quantitative data.
For example, if a customer writes a Yelp review stating “The atmosphere was great for a Friday night, but the food was a bit overpriced,” you can assign quantitative tags based on a scale or sentiment. We’ll get into how exactly to assign these tags in the next section.
Inductive Coding vs Deductive Coding
When deciding how you will scale and code your data, you’ll first have to choose between the inductive or deductive methods. We cover the pros and cons of each method below.
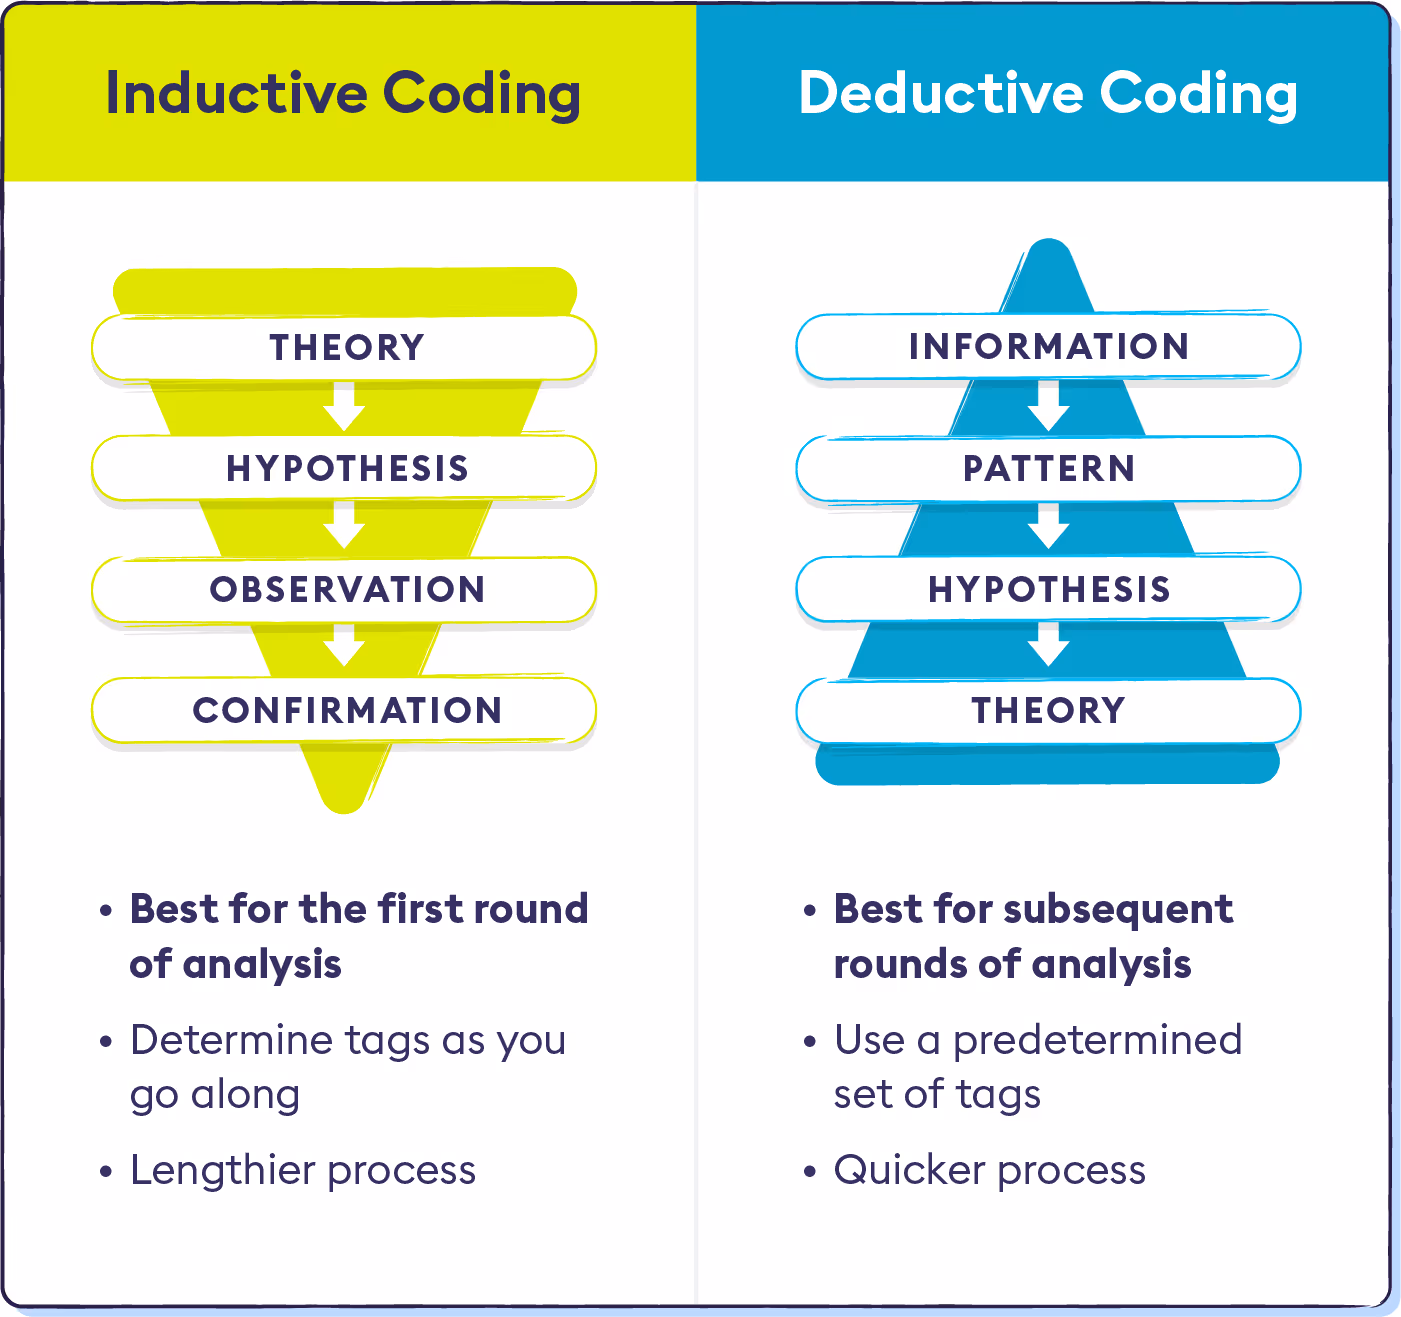
Inductive Coding
Inductive coding is when you don’t already have a set scale or measurement with which to tag the data. If you’re analysing a large amount of qualitative data for the first time, such as the first round of a customer feedback survey, then you will likely need to start with inductive coding since you don’t know exactly what you will be measuring yet.
Inductive coding can be a lengthy process, as you’ll need to comb through your data manually. Luckily, things get easier the second time around when you’re able to use deductive coding.
Deductive Coding
Deductive coding is when you already have a predetermined scale or set of tags that you want to use on your data. This is usually if you’ve already analysed a set of qualitative data with inductive reasoning and want to use the same metrics.
To continue from the example above, say you noticed in the first round that a lot of Yelp reviews mentioned the price of food, and, using inductive coding, you were able to create a scale of 1-5 to measure appetisers, entrees, and desserts.
When analysing new Yelp reviews six months later, you’ll be able to keep the same scale and tag the new responses based on deductive coding, and therefore compare the data to the first round of analysis.
3 Steps for Coding Qualitative Data From the Top-Down
For this section, we will assume that we’re using inductive coding.
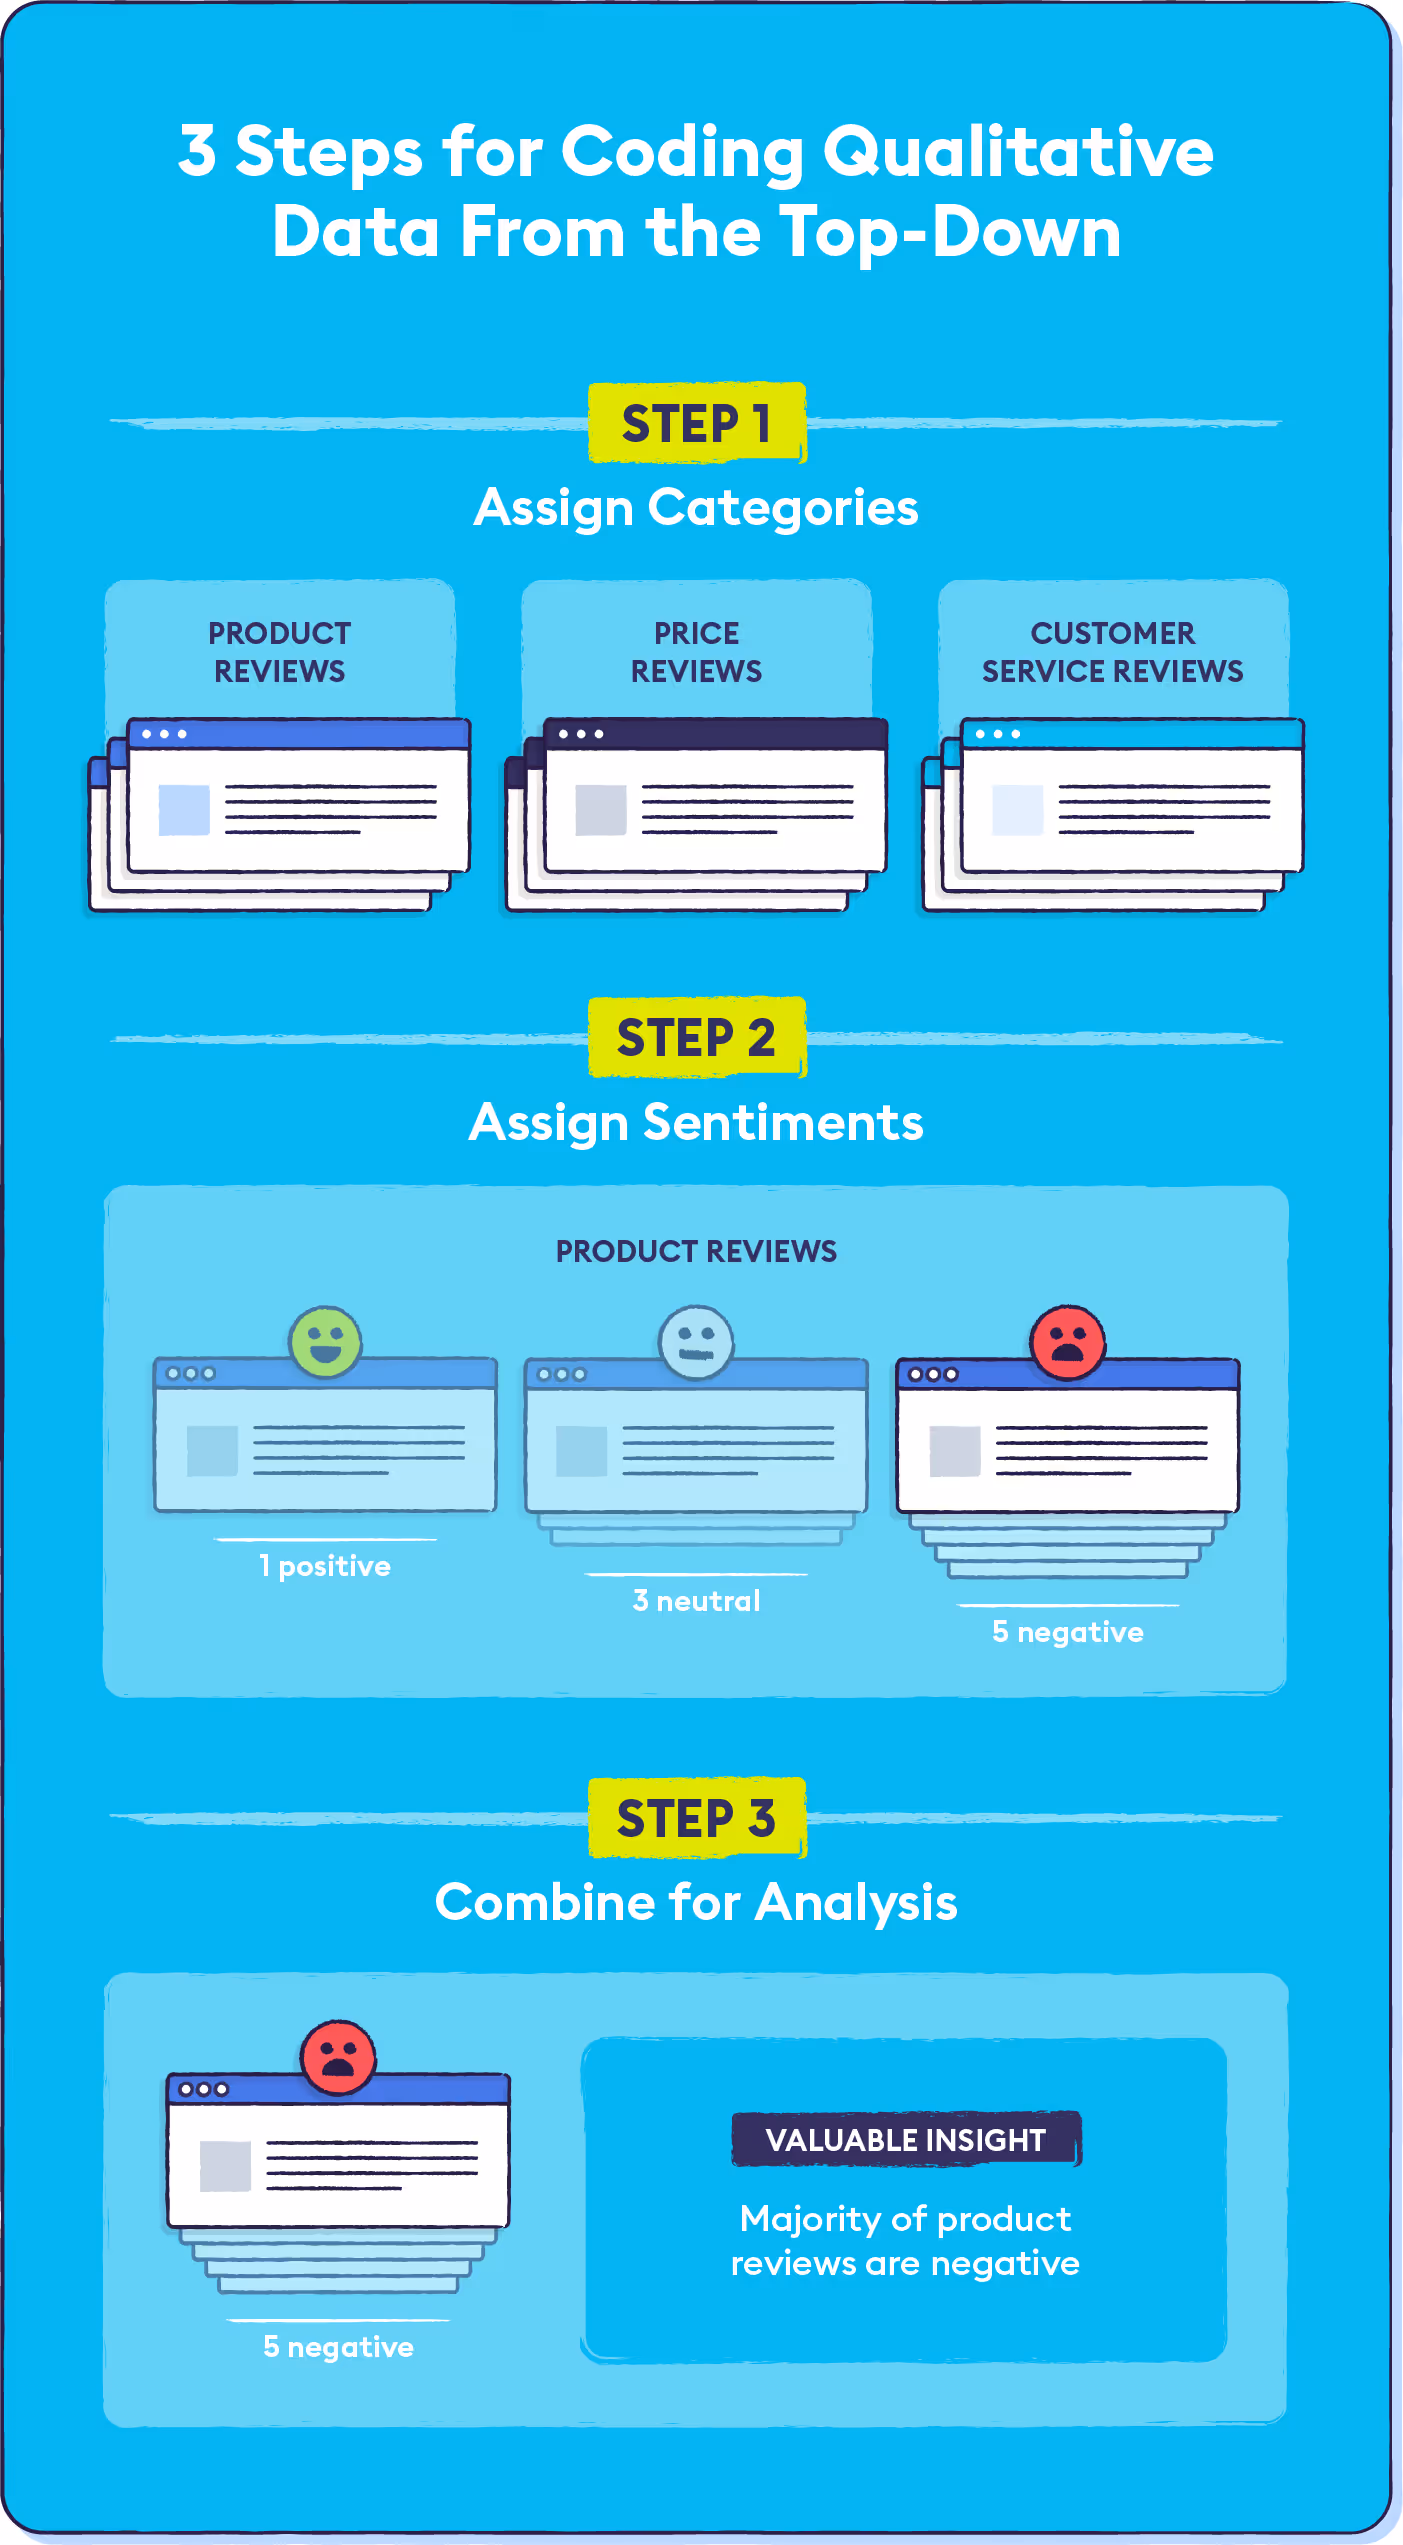
1. Start with Broad Categories
The first thing you will want to do is sort your data into broad categories. Think of each of these categories as specific aspects you want to know more about.
To continue with the restaurant example, your categories could include food quality, food price, atmosphere, location, service, etc.
Or for a business in the B2B space, your categories could look something like product quality, product price, customer service, chatbot quality, etc.
2. Assign Emotions or Sentiments
The next step is to then go through each category and assign a sentiment or emotion to each piece of data. In the broadest terms, you can start with just positive emotion and negative emotion.
Remember that when using inductive coding, you’re figuring out your scale and measurements as you go, so you can always start with broad analysis and drill down deeper as you become more familiar with your data.
3. Combine Categories and Sentiments to Draw Conclusions
Once you’ve sorted your data into categories and assigned sentiments, you can start comparing the numbers and drawing conclusions.
For example, perhaps you see that out of the 500 Yelp reviews you’ve analysed, 300 fall into the food price/negative sentiment section of your data. That’s a pretty clear indication that customers think your food is too expensive, and you may see an improvement in customer retention by dropping prices.
The three steps outlined above cover just the very basics of coding qualitative data, so you can understand the theory behind the analysis.
In order to gain more detailed conclusions, you’ll likely need to dig deeper into the data by assigning more complex sentiment tags and breaking down the categories further. We cover some useful tips and a coding qualitative data example below.
4 Tips to Keep in Mind for Accurate Qualitative Data Coding
Here are some helpful reminders to keep on hand when going through the three steps outlined above.
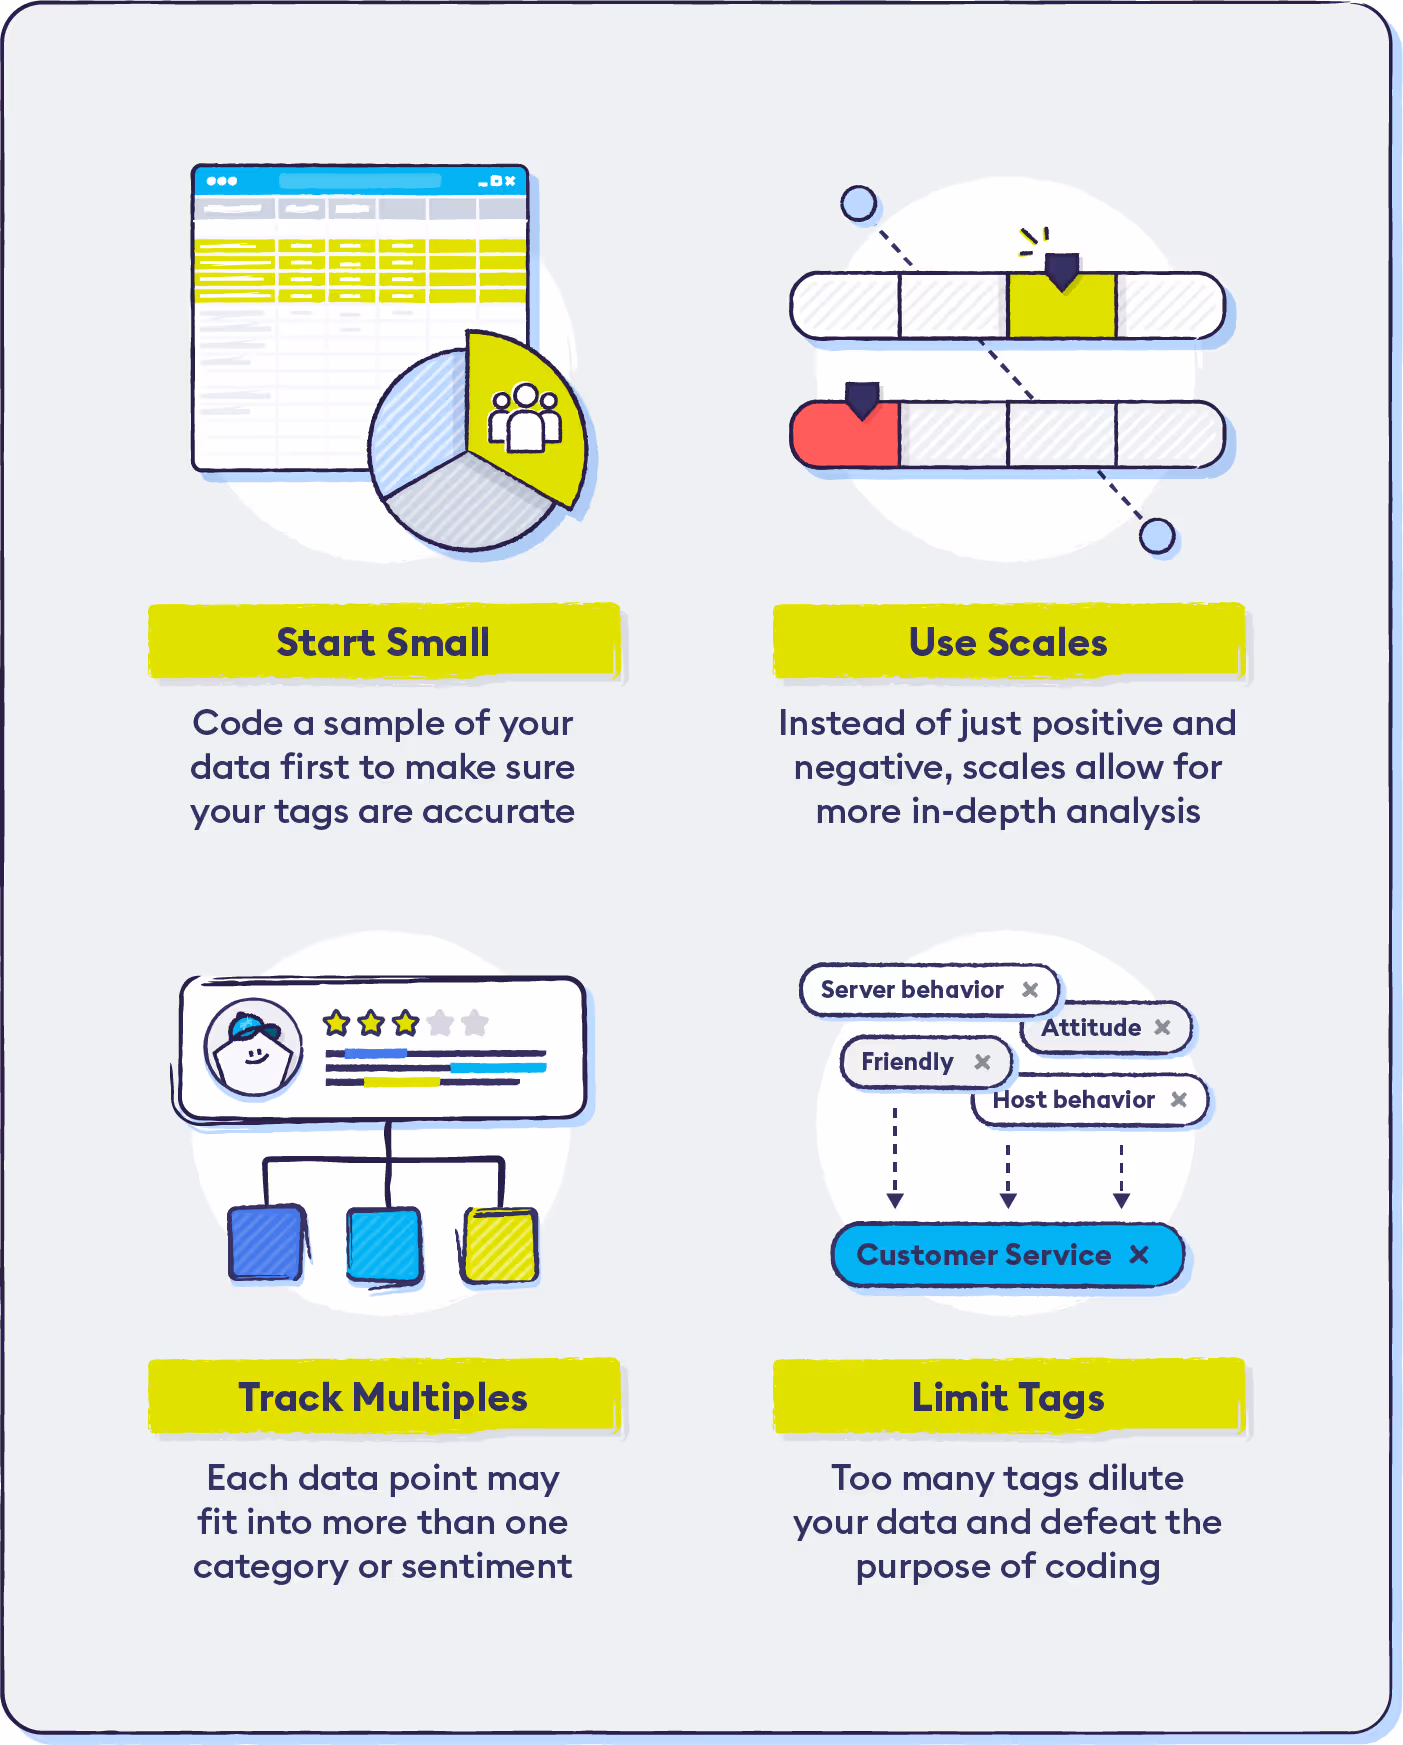
1. Start with a Small Sample of the Data
You’ll want to start with a small sample of your data to make sure the tags you’re using will be applicable to the rest of the set. You don’t want to waste time by going through and manually tagging each piece of data, only to realise at the end that the tags you’ve been using actually aren’t accurate.
Once you’ve broken up your qualitative data into the different categories, choose 10-20% of responses in each category to tag using inductive coding.
Then, continue onto the analysis phase using just that 10-20%.
If you’re able to find takeaways and easily compare the data with that small sample size, then you can continue coding the rest of the data in that same way, adding additional tags where needed.
2. Use Numerical Scales for Deeper Analysis
Instead of just assigning positive and negative sentiments to your data points, you can break this down even further by utilising numerical scales.
Exactly how negative or how positive was the piece of feedback? In the Yelp review example from the beginning of this article, the reviewer stated that the food was “a bit overpriced.” If you’re using a scale of 1-5 to tag the category “food price,” you could tag this as a ⅗ rating.
You’ll likely need to adjust your scales as you work through your initial sample and get a clearer picture of the review landscape.
Having access to more nuanced data like this is important for making accurate decisions about your business.
If you decided to stick with just positive and negative tags, your “food price” category might end up being 50% negative, indicating that a massive change to your pricing structure is needed immediately.
But if it turns out that most of those negative reviews are actually ⅗’s and not ⅕’s, then the situation isn’t as dire as it might have appeared at first glance.
3. Remember That Each Data Point Can Contain Multiple Pieces of Information
Remember that qualitative data can have multiple sentiments and multiple categories (such as the Yelp review example mentioning both atmosphere and price), so you may need to double or even triple-sort some pieces of data.
That’s the beauty of and the struggle with handling open-ended or free-form responses.
However, these responses allow for more accurate insights into your business vs narrow multiple-choice questions.
4. Be Mindful of Having Too Many Tags
Remember, you’re able to draw conclusions from your qualitative data by combining category tags and sentiment tags.
An easy mistake for data analysis newcomers to make is to end up with so many tags that comparing them becomes impossible. This usually stems from an overabundance of caution that you’re tagging responses accurately.
For example, say you’re tagging a review that’s discussing a restaurant host’s behavior. You put it in the category “host/hostess behavior” and tag it as a ⅗ for the sentiment.
Then, you come across another review discussing a server’s behaviour that’s slightly more positive, so you tag this as “server behaviour” for the category and 3.75/5 for the sentiment.
By getting this granular, you’re going to end up with very few data points in the same category and sentiment, which defeats the purpose of coding qualitative data.
In this example, unless you’re very specifically looking at the behaviour of individual restaurant positions, you’re better off tagging both responses as “customer service” for the category and ⅗ for the sentiment for consistency’s sake.
Coding Qualitative Data Example
Below we’ll walk through an example of coding qualitative data, utilising the steps and tips detailed above.
Step 1: Read through your data and define your categories. For this example, we’ll use “customer service,” “product quality,” and “price.”
Step 2: Sort a sample of the data into the above categories. Remember that each data point can be included in multiple categories.
- “This software is amazing, does exactly what I need it to [Product Quality]. However, I do wish they’d stop raising prices every year as it’s starting to get a little out of my budget [Price].”
- “Love the product [Product Quality], but honestly I can’t deal with the terrible customer service anymore [Customer Service]. I’ll be shopping around for a new solution.”
- “Meh, this software is okay [Product Quality] but cheaper competitors [Price] are just as good with much better customer service [Customer Service].”
Step 3: Assign sentiments to the sample. For more in-depth analysis, use a numerical scale. We’ll use 1-5 in this example, with 1 being the lowest satisfaction and 5 being the highest.
- Product Quality:
- “This software is amazing, does exactly what I need it to do” [5/5]
- “Love the product” [5/5]
- “Meh, this software is okay [⅖]
- Customer Service:
- “Honestly I can’t deal with the terrible customer service anymore [⅕]
- “...Much better customer service,” [⅖]
- Price:
- “However, I do wish they’d stop raising prices every year as it’s starting to get a little out of my budget.” [⅗]
- “Cheaper competitors are just as good.” [⅖]
Step 4: After confirming that the established category and sentiment tags are accurate, continue steps 1-3 for the rest of your data, adding tags where necessary.
Step 5: Identify recurring patterns using data analysis. You can combine your insights with other types of data, like demographic and psychographic customer profiles.
Step 6: Take action based on what you find! For example, you may discover that customers aged 20-30 were the most likely to provide negative feedback on your customer service team, equating to ⅖ or ⅕ on your coding scale. You may be able to conclude that younger customers need a more streamlined way to communicate with your company, perhaps through an automated chatbot service.
Step 7: Repeat this process with more specific research goals in mind to continue digging deeper into what your customers are thinking and feeling. For example, if you uncover the above insight through coding qualitative data from online reviews, you could send out a customer feedback survey specifically asking free-form questions about how your customers would feel interacting with a chatbot instead.
How AI tools help with Coding Qualitative Data
Now that you understand the work that goes into coding qualitative data, you’re probably wondering if there’s an easier solution than manually sorting through every response.
The good news is that, yes, there is. Advanced AI-backed tools are available to help companies quickly and accurately analyse qualitative data at scale, such as customer surveys and online reviews.
These tools can not only code data based on a set of rules you determine, but they can even do their own inductive coding to determine themes and create the most accurate tags as they go.
These capabilities allow business owners to make accurate decisions about their business based on actual data and free up the necessary time and employee bandwidth to act on these insights.
The infographic below gives a visual summary of how to code qualitative data and why it’s essential for businesses to learn how:
Try Chattermill today today to learn how our AI-powered software can help you make smarter business decisions.
Coding Qualitative Data: FAQs
What does coding qualitative data mean?
Coding qualitative data is the process of labeling and categorizing open-ended feedback, survey responses, or interview transcripts. It helps researchers and businesses turn raw text into structured insights for analysis and decision-making.
Why is coding qualitative data important for customer research?
Without coding, qualitative data remains unstructured and difficult to analyze. Coding makes it possible to identify patterns, themes, and trends that can inform product improvements and customer experience strategies.
What are the main methods of coding qualitative data?
The two most common methods are manual coding, where researchers tag responses by hand, and automated coding, which uses software or AI to process large volumes of text quickly. Many organizations combine both for accuracy and efficiency.
What are common mistakes when coding qualitative data?
A frequent mistake is using vague or inconsistent codes, which leads to unreliable insights. Another is failing to update code frameworks as new themes emerge, causing gaps in analysis.
Can coding qualitative data be automated?
Yes, many platforms use natural language processing and machine learning to automate coding. Automation works best for high-volume datasets, while manual review ensures nuance and context are not lost.


CX intelligence
for teams and agents
Book a meeting


COMPARISONS
Chattermill Analytics Limited
68 Hanbury St, London, E1 5JL,
United Kingdom