Impact Analysis: Understanding Customer Feedback Trends


The CX intelligence
platform that's AI-native by design
Book a demoFor CX, Support, and Product leaders, an understanding of customer satisfaction and loyalty is often enhanced by the metrics they track.
For those that collect it, NPS data provides a tried-and-tested benchmark of customer loyalty, whilst Chattermill’s net sentiment metric gives you a window into how your customer experience is performing across any of the channels you collect.
But as more and more companies become dependent on these scores, so too is there a growing absence of those who actually understand what’s driving them to change.
Without clear insight into why your scores are the way they are, you’re left with a shallow understanding of what’s actually affecting your customer experience, and a lack of direction as to what and where you should prioritise.
That’s where Impact Analysis comes in.
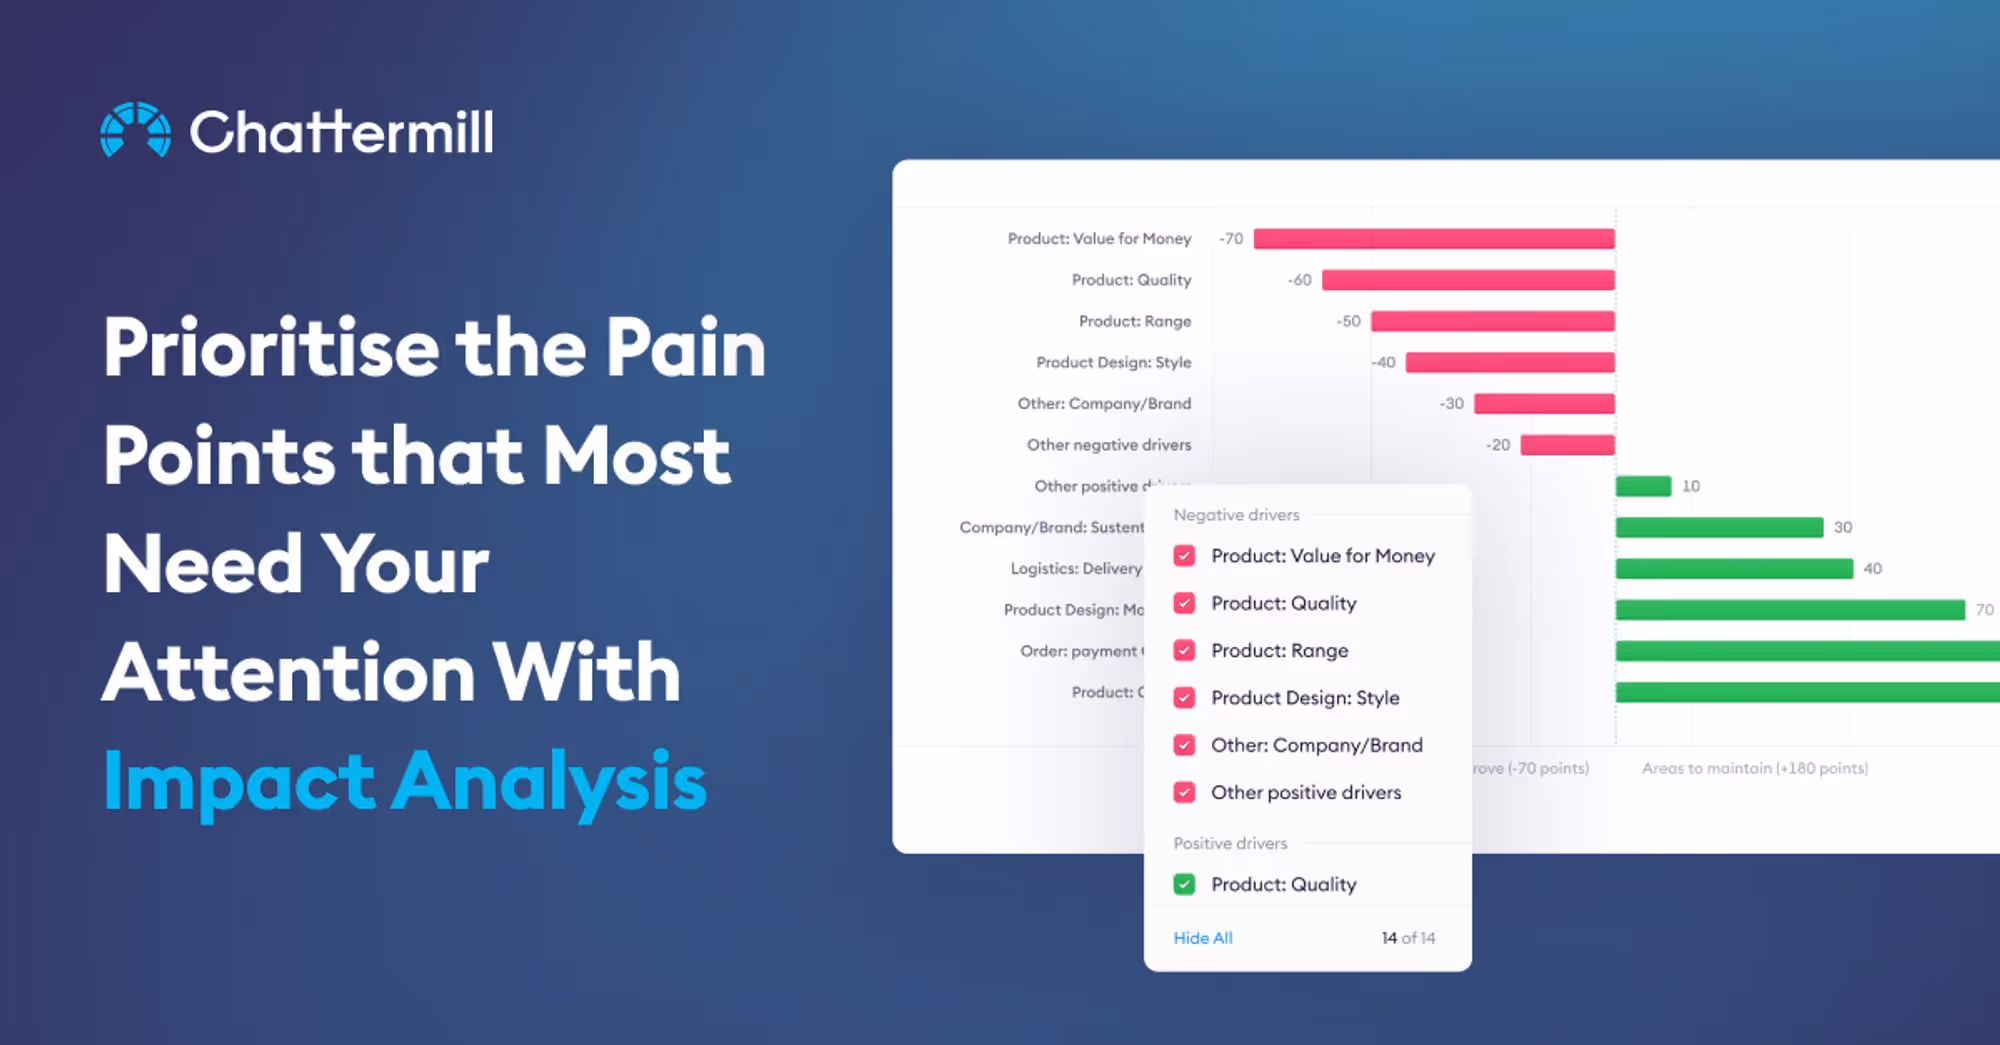
Prioritise the Pain Points that Most Need Your Attention
Impact Analysis helps CX, Support and Product professionals understand which trends influence their key metrics, discover actionable insights, and ultimately make smarter CX decisions.
With just a few clicks, you can discover the trends influencing your key metrics to rise or fall. Armed with this knowledge, you can make smarter decisions about where work is needed - whether they be quick fixes or long term resolutions.
As well as being available on NPS, Impact Analysis is now enabled for net sentiment, meaning anyone can start using it today, on any dataset.
Using Net Sentiment and Impact Analysis to Improve CX
Net sentiment and Impact Analysis work together to provide you with a comprehensive understanding of your customer experience across all of your channels.
Net Sentiment is Chattermill’s own metric, designed to measure and compare sentiment across any of your themes, data sources or customer segments. It counts both positive and negative mentions to give you an accurate picture of how your customers feel.
Net sentiment is calculated by subtracting the % of negative theme mentions from the % of positive ones, and ranges on a scale from -100 to 100. It shifts depending on the segment you select, meaning you can take a glance at how your customer experience is performing in granular or as broad a selection as you would prefer
With Impact Analysis, you can now dig deeper into score shifts, see what’s driving change, and prioritise the pain points that most need your attention. Let’s take a closer look.
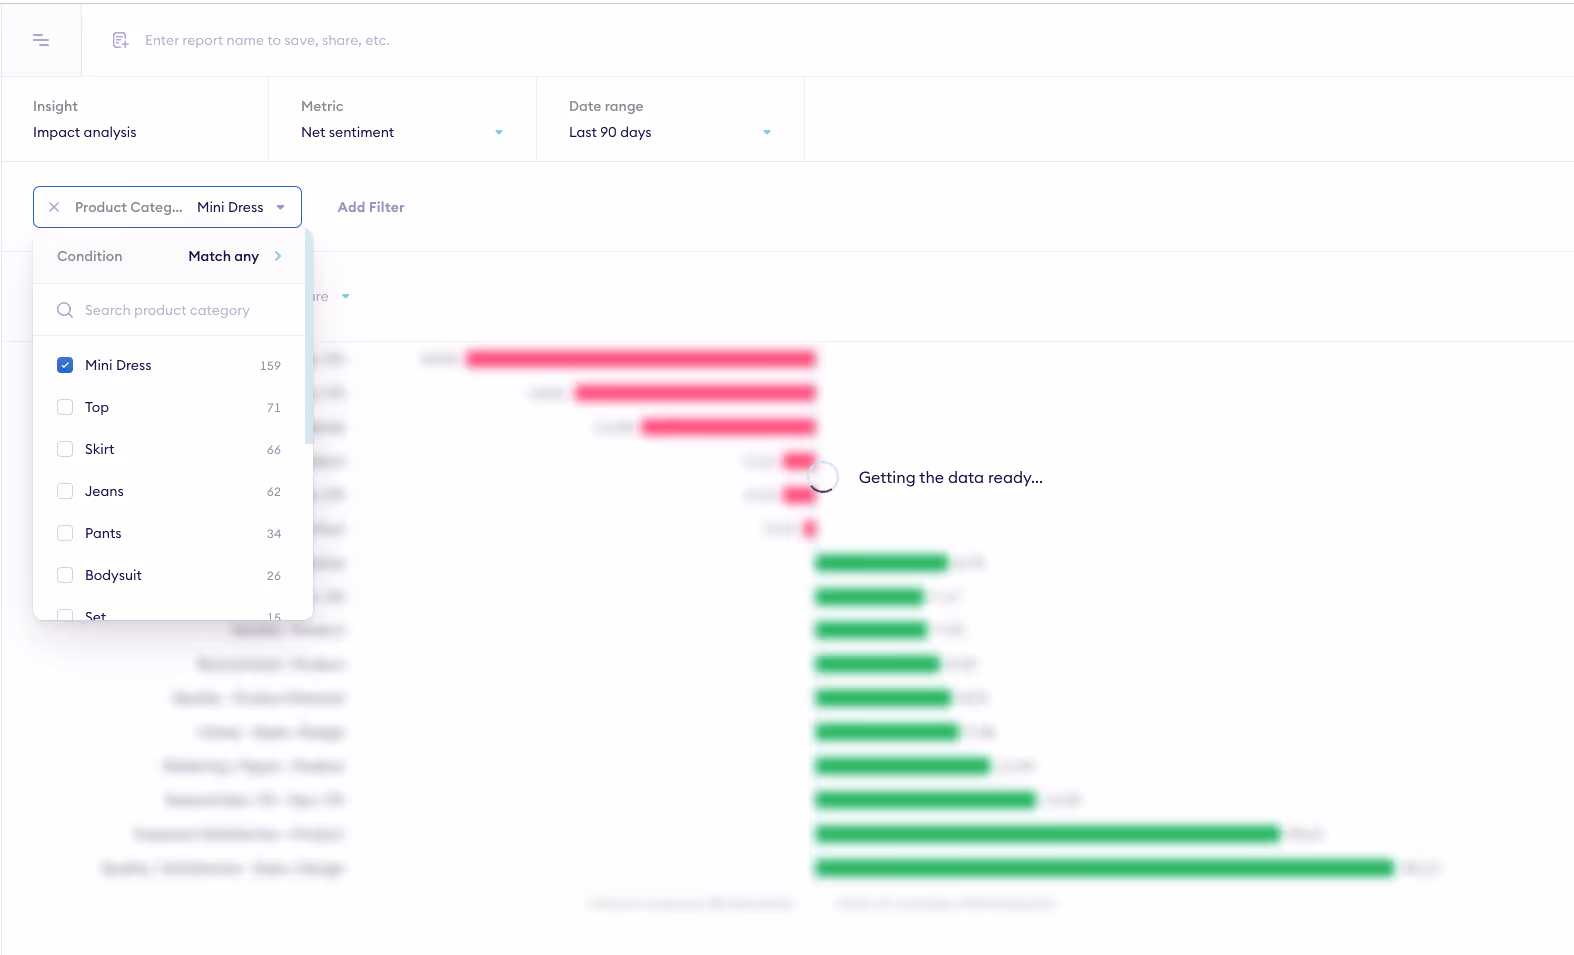
Say you’re a Retail Product Manager who’s noticed a shift in your net sentiment score on a particular product. From within the Insights tab, you can apply Impact Analysis to net sentiment, set the date range to when the score changed, and adjust filters to match the correct product. In this case, we’ll be looking at Product Category > Mini Dresses.
In just a few clicks, a visualisation showing you the trends impacting your net sentiment is brought up. On the left hand side in red are themes negatively impacting your net sentiment score, whilst those on the right are having a positive impact. They’re ranked depending on the extent to which they’re detracting or promoting your score.
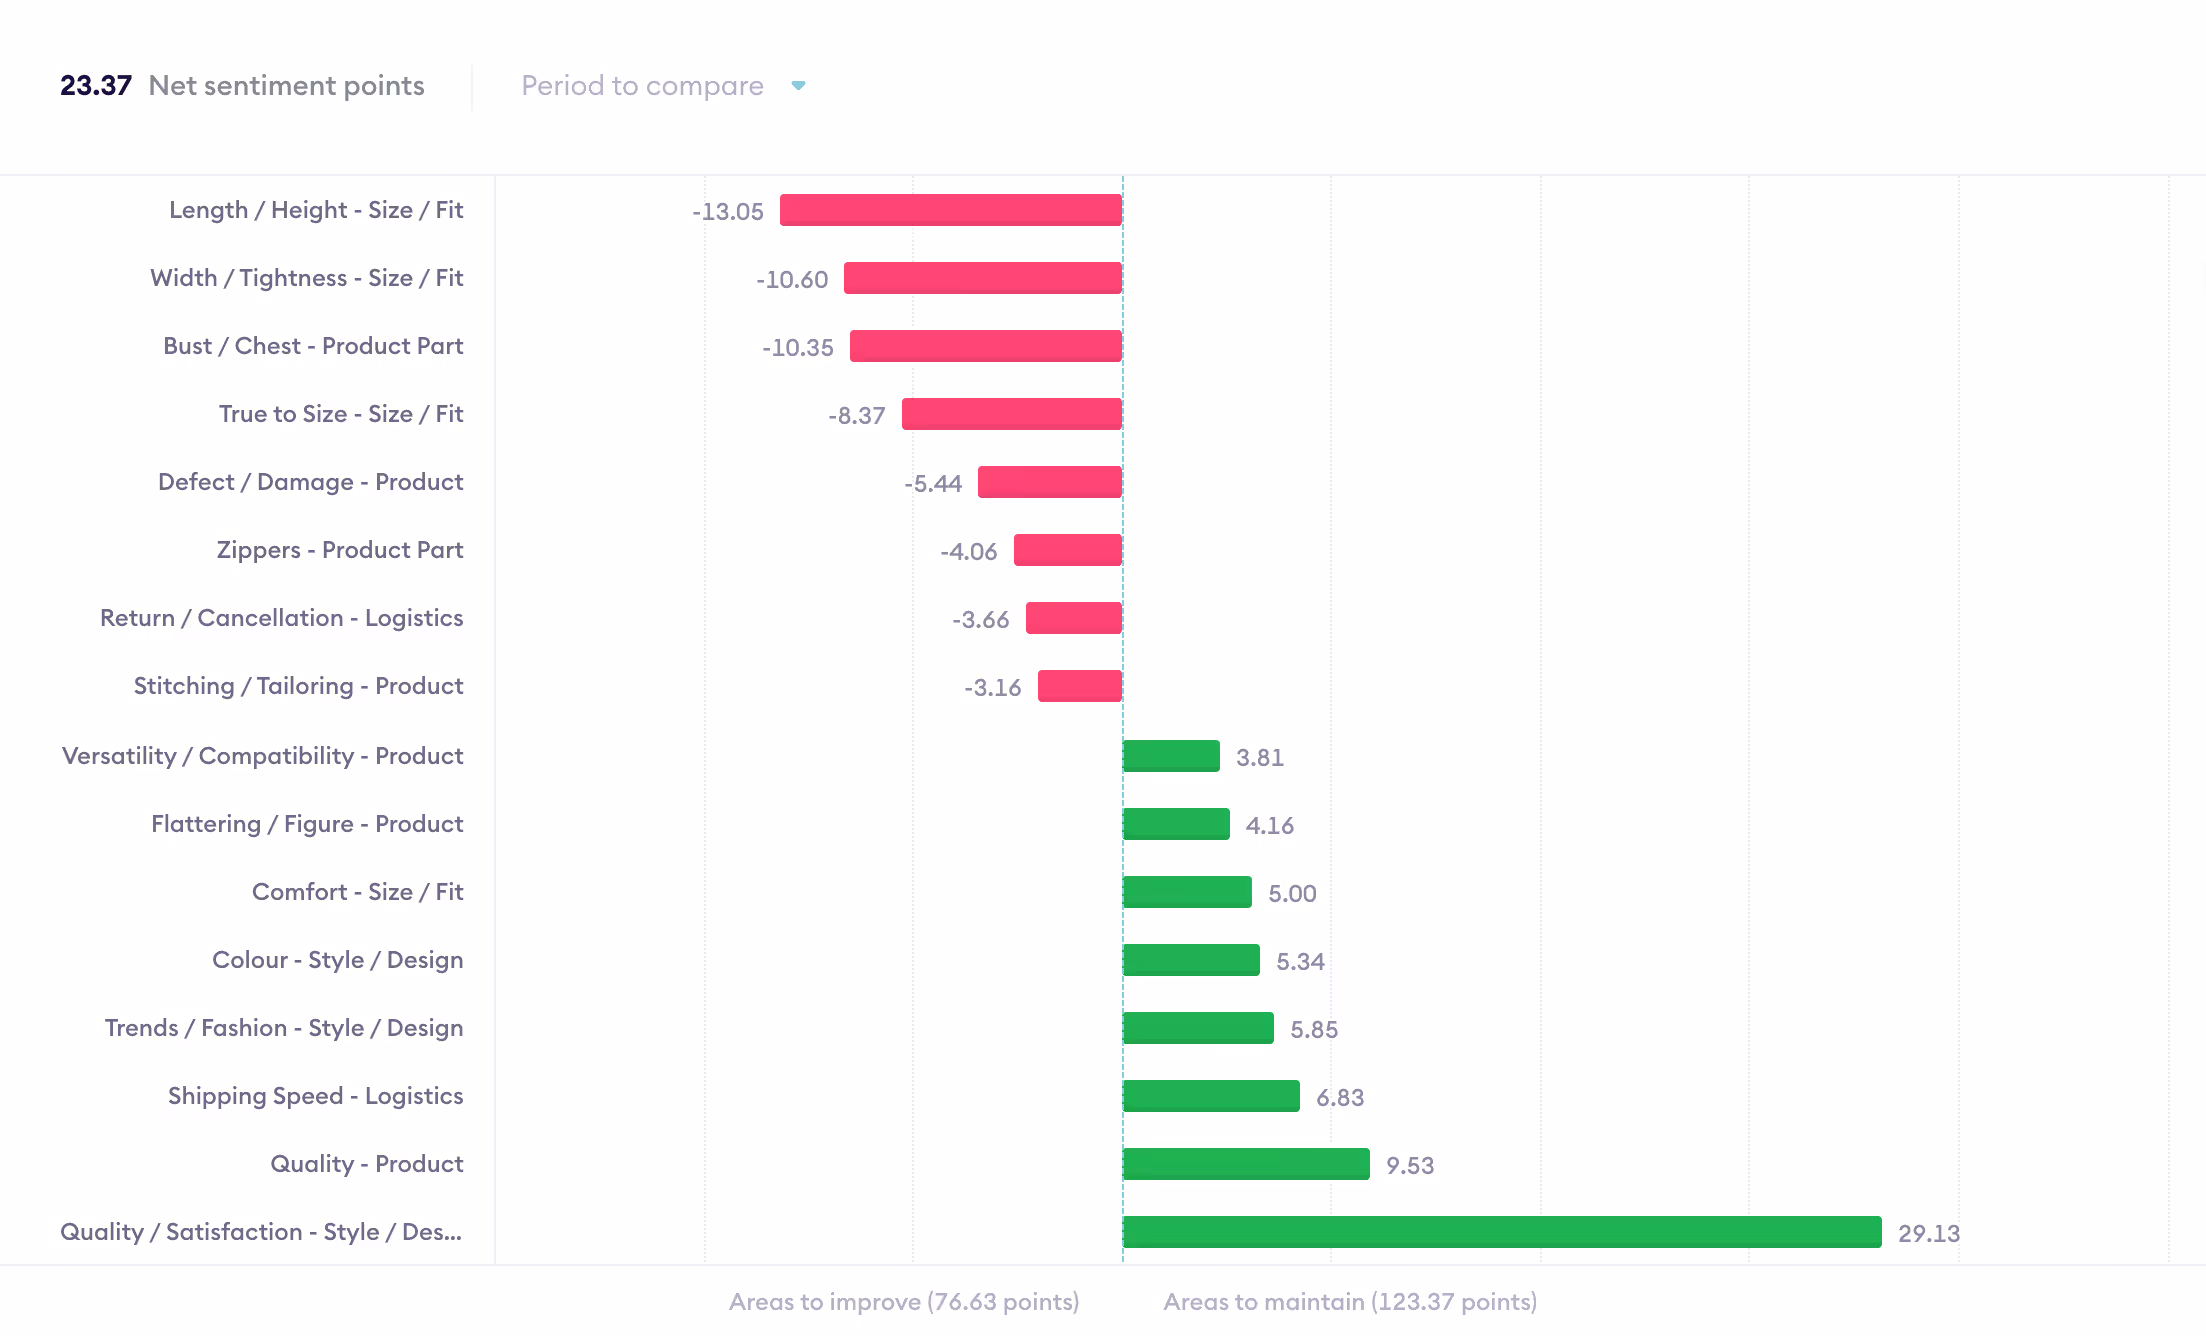
For instance, we can see that a theme positively impacting your net sentiment is Quality / Satisfaction, which is pushing your score up by over 30 points. Other positive drivers include shipping speed, comfort, colour and the figure of the mini skirts - meaning these aspects are boosting your net sentiment.
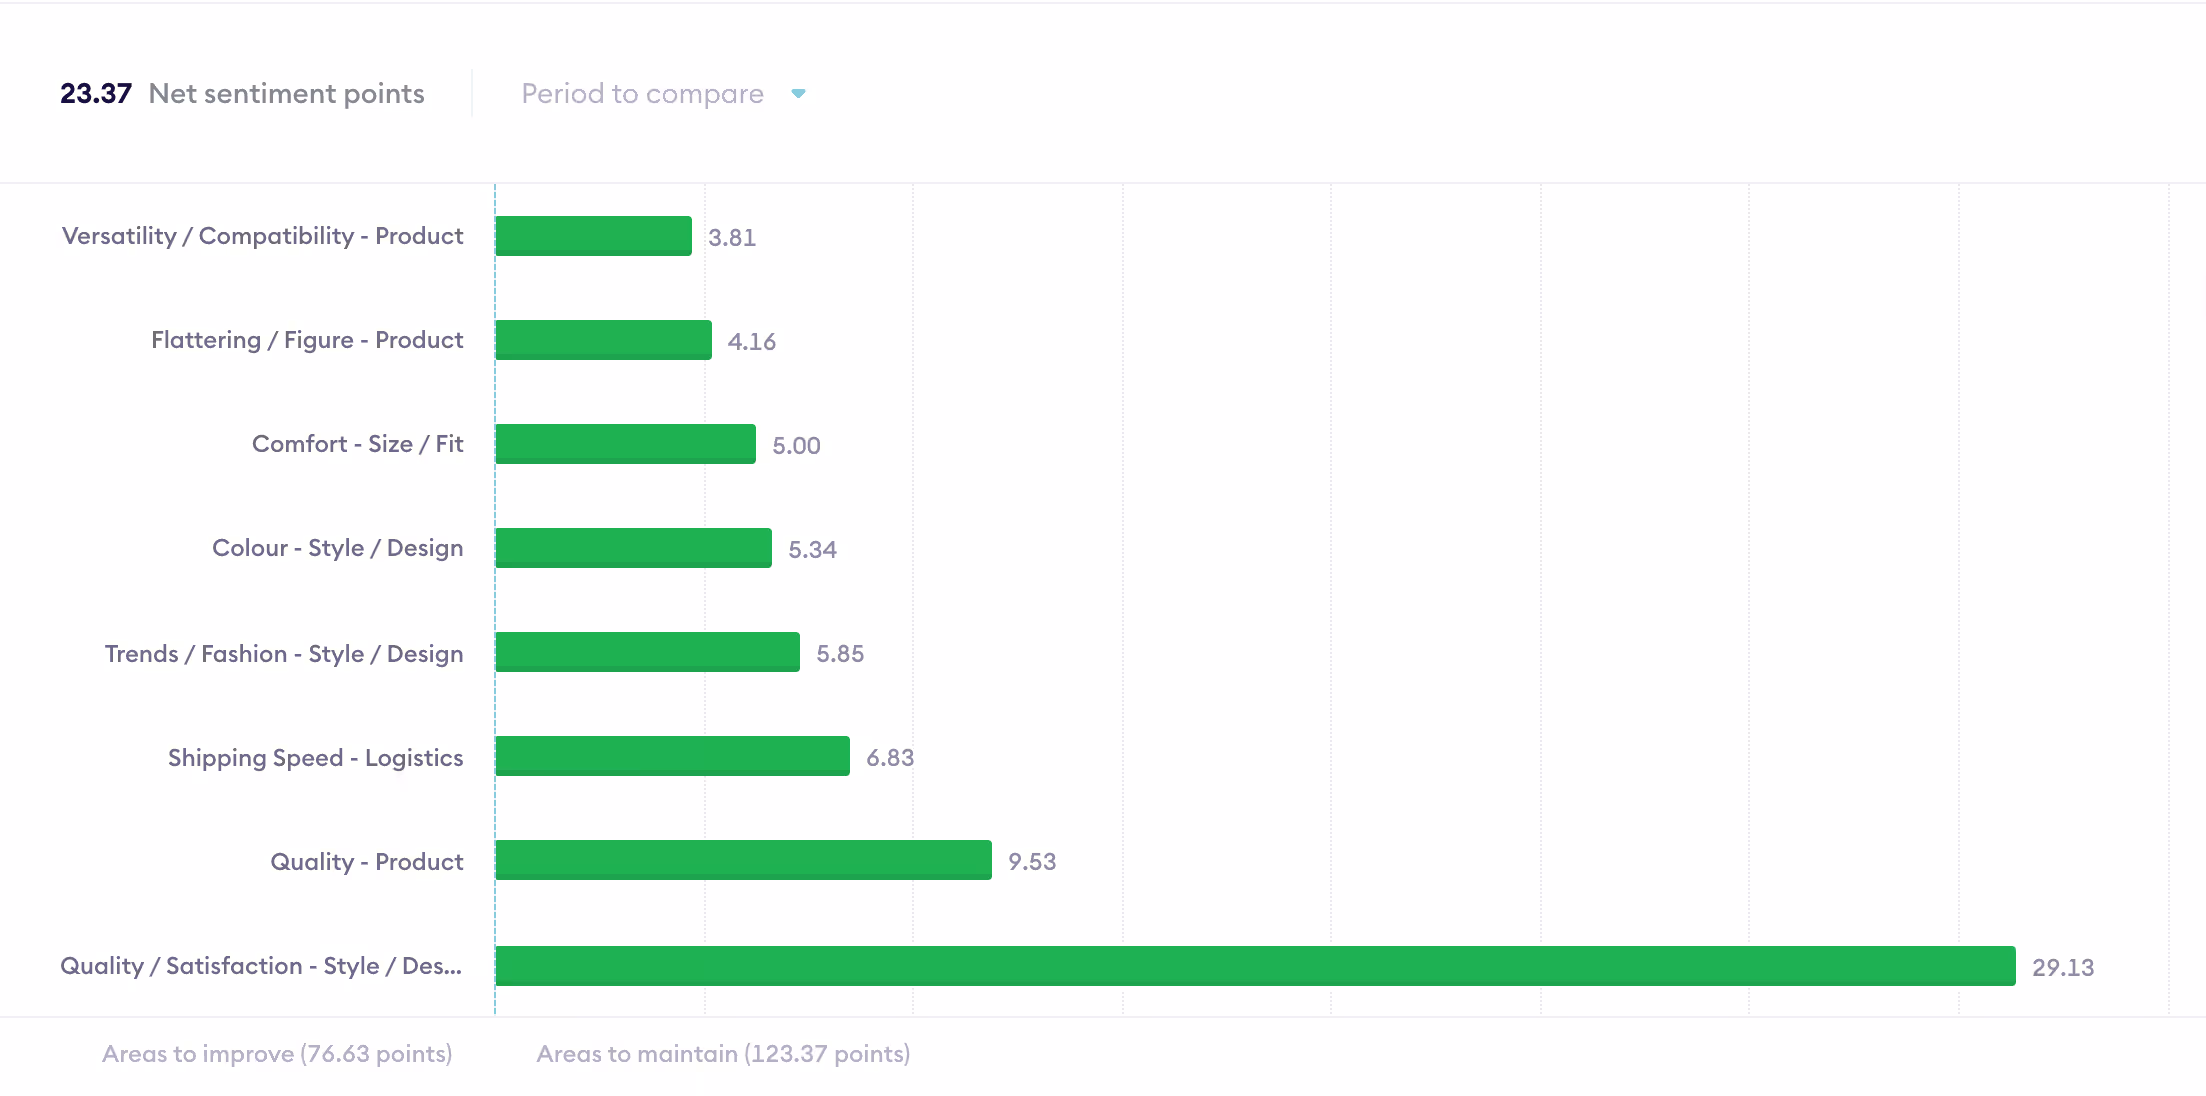
This tells you what you’re doing right, but also gives you an idea of how important maintaining each of these qualities are too. If the miniskirts were to drastically drop in terms of quality, you could expect a huge drop off in your net sentiment score too.
Perhaps more valuably, we can drill down into what customers aren’t enjoying about their experience buying miniskirts from you. There’s several issues with sizing - Length, Width / Tightness, Chest and ‘True to Size’ are all themes negatively affecting your score, with a combined impact of over 40 points.
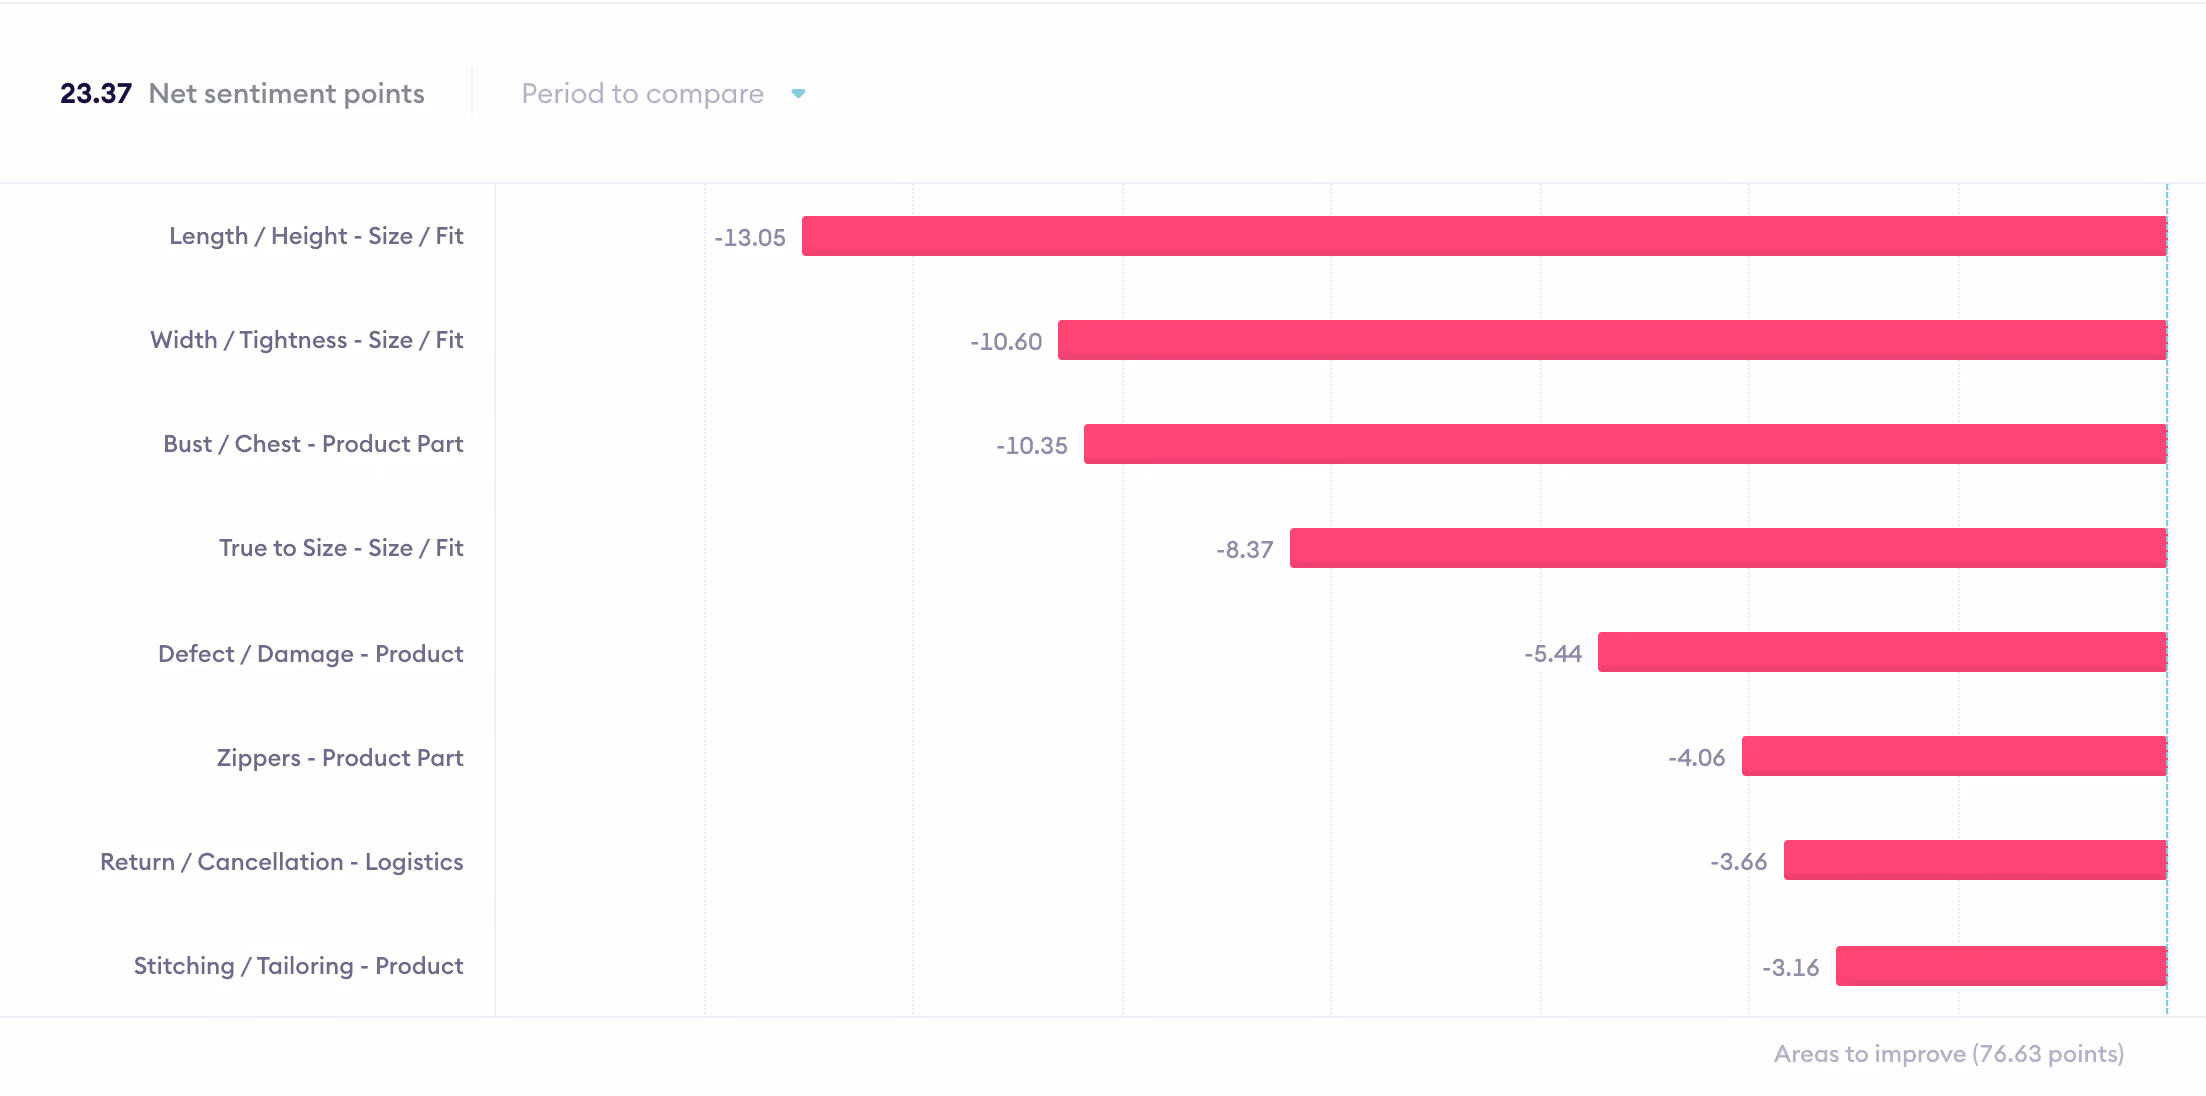
Thankfully, now that you’re aware of these issues you can take appropriate action. You might have conversations with your design team or supplier about adjusting the height and width of the items, or correcting size guides on your website so customer expectations line-up better with what arrives.
What’s more, Impact Analysis lets you compare the impact of trends over time. If we select Period to Compare > Previous 90 Days - you’ll be able to see the previous period’s impact alongside the current one.
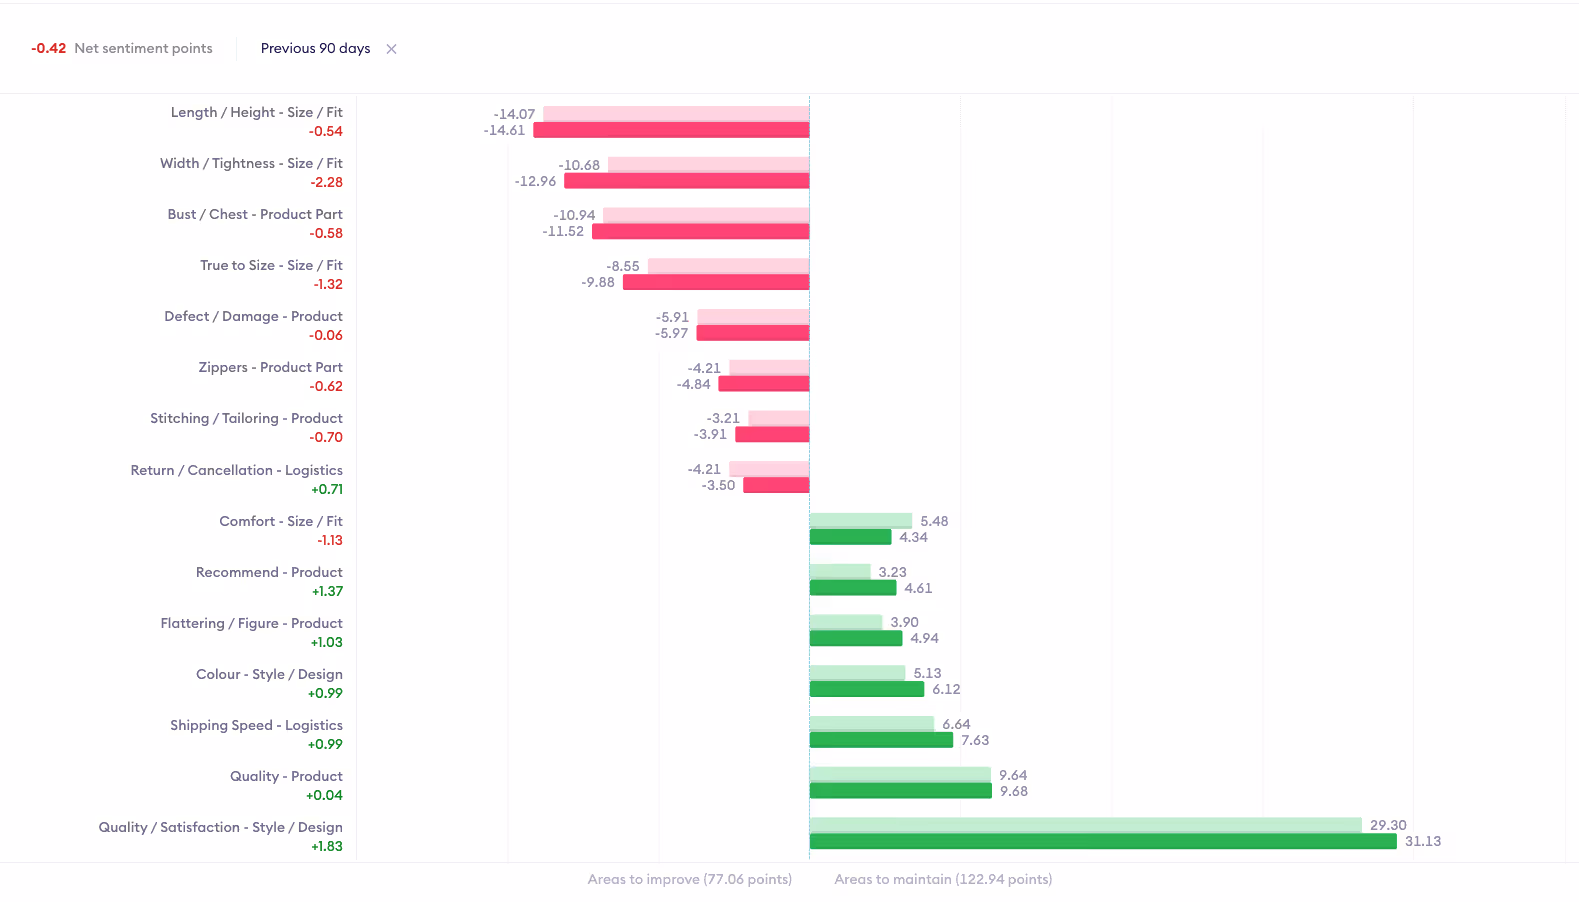
In this case, you can see that over the past 90 days, the aforementioned sizing issues actually worsened - for instance Width / Tightness increased its negative impact by 2 points. However, you can also see that Quality / Satisfaction increased, suggesting that customer expectations lined up better in this period than the previous one.
Armed with this knowledge, you can investigate what’s caused these shifts to occur. This gives you valuable insight into emerging trends, and enables you to spot issues before it’s too late.
Empower your team with powerful insights
Start using Impact Analysis today to uncover its valuable insights. Add Impact Analysis to your shared dashboards and distribute insights with your team - so you can all work towards prioritising the most impactful customer pain points.
Want to see how the Chattermill Unified Customer Intelligence platform can help you find insights with Impact Analysis? Schedule your demo today!
Already a Chattermill customer? Read our FAQ or get in touch with your CSM to learn how you can get the most out of Impact Analysis, or head to the Insights section in Chattermill to give it a try right away.
Impact Analysis: FAQs
What is impact analysis in customer experience?
Impact analysis is the process of examining why key customer experience metrics change over time. It helps businesses understand the underlying factors driving improvements or declines.
Why is impact analysis important?
It provides context to raw metrics like NPS, CSAT, or churn rate. By identifying the reasons behind score changes, businesses can make targeted improvements that directly affect customer satisfaction and retention.
What data is used in impact analysis?
Impact analysis uses customer feedback, survey responses, behavioral data, and operational performance metrics. Combining these sources uncovers correlations between customer sentiment and business outcomes.
How does impact analysis help improve customer experience?
By linking metric changes to specific drivers—such as product issues, service delays, or new features—companies can prioritize fixes that have the greatest impact on customer perception.
What tools support impact analysis?
Businesses often use analytics platforms, machine learning models, and visualization tools to detect patterns in large datasets and understand the drivers behind metric changes.
How often should companies perform impact analysis?
Impact analysis should be conducted regularly, especially after new product launches, service updates, or major shifts in customer behavior. Continuous monitoring ensures businesses can respond quickly to changes.
What challenges come with impact analysis?
Challenges include isolating the true drivers of change, managing complex datasets, and ensuring findings are shared across teams to drive coordinated action.
Can AI enhance impact analysis?
Yes. AI can process large volumes of data, detect subtle patterns, and identify hidden correlations that humans might miss. This makes analysis faster, more accurate, and more actionable.


CX intelligence
for teams and agents
Book a meeting


COMPARISONS
Chattermill Analytics Limited
68 Hanbury St, London, E1 5JL,
United Kingdom