
Running a customer feedback survey seems simple enough; you come up with a few questions, blast them out to everyone on your email lists, and get a bunch of data points to work with.
Though that process covers the basics, it’s a lot more difficult when you’re trying to make sure that the data you get is actually useful. This means data that is un-skewed, unbiased, and that you can draw meaningful conclusions from. You don’t have to be a data wizard in order to conduct accurate survey data analysis.
Below are simple steps to take before and after running a survey to improve the validity of your survey results for better customer experience analysis.
Key Takeaways
- Combine Data Types: The most valuable insights come from the intersection of demographic (who they are) and psychographic (how they feel) data.
- Prioritize Scales: Use numerical scales (e.g., 1-10) rather than binary "Yes/No" questions to capture greater depth and nuance.
- Timing is Critical: Trigger surveys at key milestones, such as post-purchase, renewal periods, or immediately following a churn event.
- Ensure Reliability: Validate results by calculating statistical significance, margin of error, and confidence levels to ensure findings represent the broader population.
- Leverage AI: Use AI tools to automate theme and sentiment analysis for open-ended questions, allowing for scalable qualitative insights.
What is Survey Data Analysis?
Survey data analysis is the process of drawing conclusions from what you’ve gathered. Whether this is hard percentages, qualitative statements, or something in the middle, going through your data and identifying text or sentimental patterns can help you figure out wider takeaways for the general population the data represents.
For example, if you’re a restaurant running a customer feedback survey and you notice a pattern of people complaining that their food delivery is cold, you’ll probably be able to better understand why delivery orders have been less frequent.
Why is it Important to Conduct Survey Analysis?
Survey analysis is important because it allows you to draw broader conclusions about your audience. You can’t ask every single person what they think about your company and implement changes to suit every individual.
Numbers on their own are meaningless, it’s the trends and patterns you uncover that allow you to make meaningful decisions.
Note though, you can increase survey open and response rates by having engaging survey email subject lines.
Key Survey Analysis Variables
Though there are countless variables you could be measuring in your surveys, most of them can be categorized into the following two types. The intersection of these two types of variables is usually where the most valuable insights come from.
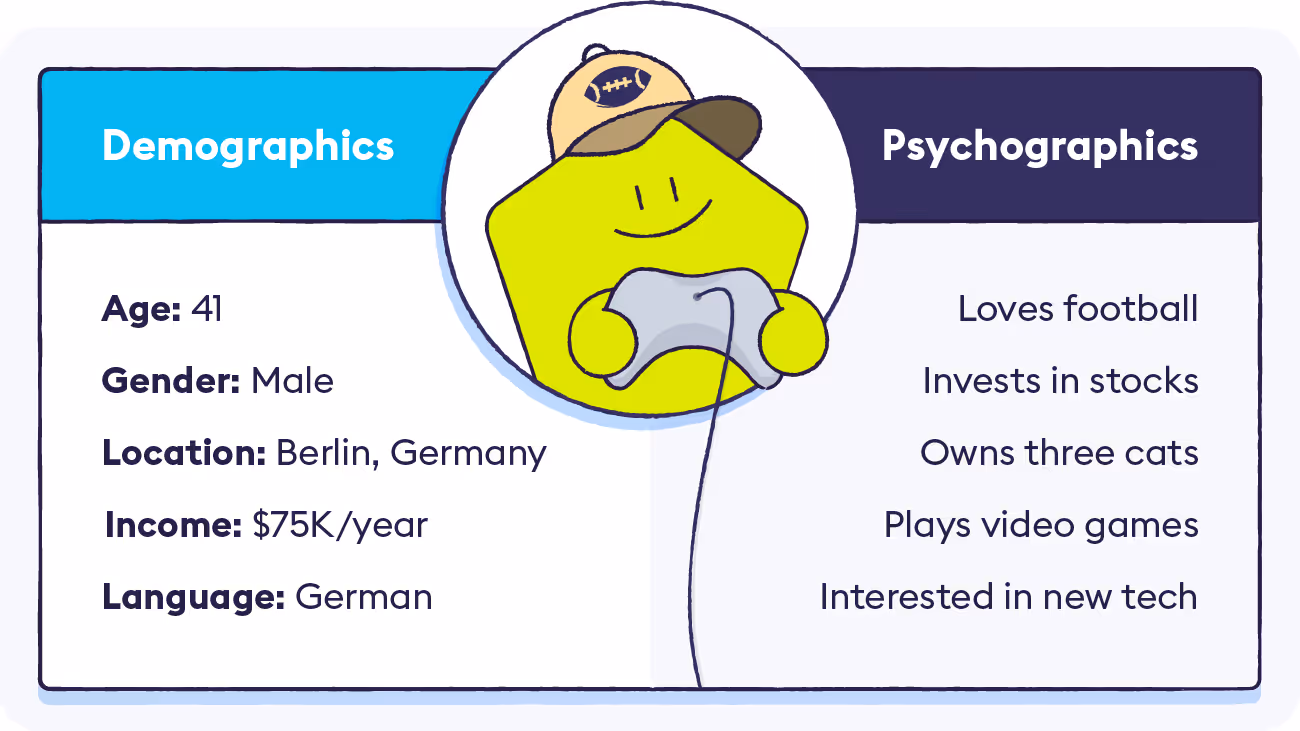
1. Demographic Data
Demographic data encompasses the specific characteristics of a given population. Examples of demographic data include: age, gender, location, income, and language along with many other traits that can be used to define a set of respondents.
For example, you could find that women aged 50+ give the most positive feedback for a certain product, and therefore shift your marketing tactics to target this type of audience with ads pushing that product.
2. Psychographic Data
Psychographic data can be a little more difficult to pin down, as it is typically qualitative vs demographic data which is quantitative.
Psychographic data includes a person’s opinions, feelings, and interests about different things in the world, and can be used to determine how they will respond to products and marketing efforts.
Two people may have identical demographic characteristics but very different psychographics, meaning they probably shouldn’t be placed in the same customer segment.
How to Collect Survey Data
The best survey data analysis in the world isn’t going to help you if the data you collect is inherently flawed.
A customer’s experience of a survey is a part of how they experience your business - it can be the definition of an easy win or you can shoot yourself in the foot. Below we outline best practices for gathering survey data to make sure it’s accurate and usable.
1. How to Ask
The first component in gathering accurate survey data is to formulate your questions in a specific way. We break down the key things to think about ahead of time:
Consistent Metrics: You will want to use consistent methods for measuring responses across your surveys. This goes for both surveys separated by time and by segment. For example, a survey sent out six months ago to men ages 20 - 30 should have similar metrics as a survey sent out one year ago to men aged 40+. This way, you can track changes over time and across different touchpoints.
Different Descriptors: Following up on the previous point, you’ll obviously need to word your survey questions differently depending on who you’re asking and what you’re asking them about. The important thing is to make sure that each question you ask can be boiled down to reveal the same consistent metrics across your data.
Numerical Scales: Whenever possible, respondents should be able to answer your question using some sort of scale vs a “yes or no” or “thumbs up/thumbs down” response. This could take the form of a 1 - 10 ranking, a “strongly agree to strongly disagree” scale, or anything else that makes sense. When it comes down to it, binary responses like “yes or no” don’t provide you very much insight, where numerical scales allow for greater depth and analysis.
Freeform vs Multiple-Choice: Using freeform or multiple-choice answers depends on the insights you are looking to gain. In general, free form questions offer more insight on the product and customer experience. Many respondents won’t be motivated enough to answer a long form multiple choice service to fully explain their thoughts. It's better to let the user explain what's on their mind using Open-ended questions, when implemented correctly, allow you to capture a much richer level of insight than multiple choice surveys whilst dramatically reducing the overall length of surveys.
Open vs Closed Questions: When asking for free form feedback, the question you ask should be open-ended, unless you have a very specific reason to ask a closed-ended question. This is because you risk shoe-horning your respondents into giving feedback that may not be accurate. For example, an open question such as “Please tell us about your experience” allows for a wide variety of responses, vs a closed question such as “What did you enjoy about your experience?” This closed-ended question assumes that the respondent did enjoy their experience, which may not actually be the case. It’s important to note that these types of questions will also need to be coded so that they match the metrics of all your other questions and can be compared equally.

Other Common Pitfalls: In addition to the points above, there are a number of other traps you can fall into when structuring your survey that could lead to biased responses. These include: asking leading questions, surveys that are too long, over-surveying people, and starting with an already-biased audience.
Take a look at our full guide on avoiding survey response bias to learn much more about how to properly write your survey questions.
2. When to Ask
Now that you know how to ask your survey questions, it’s important to understand the best points in the customer journey for when to survey your customers.
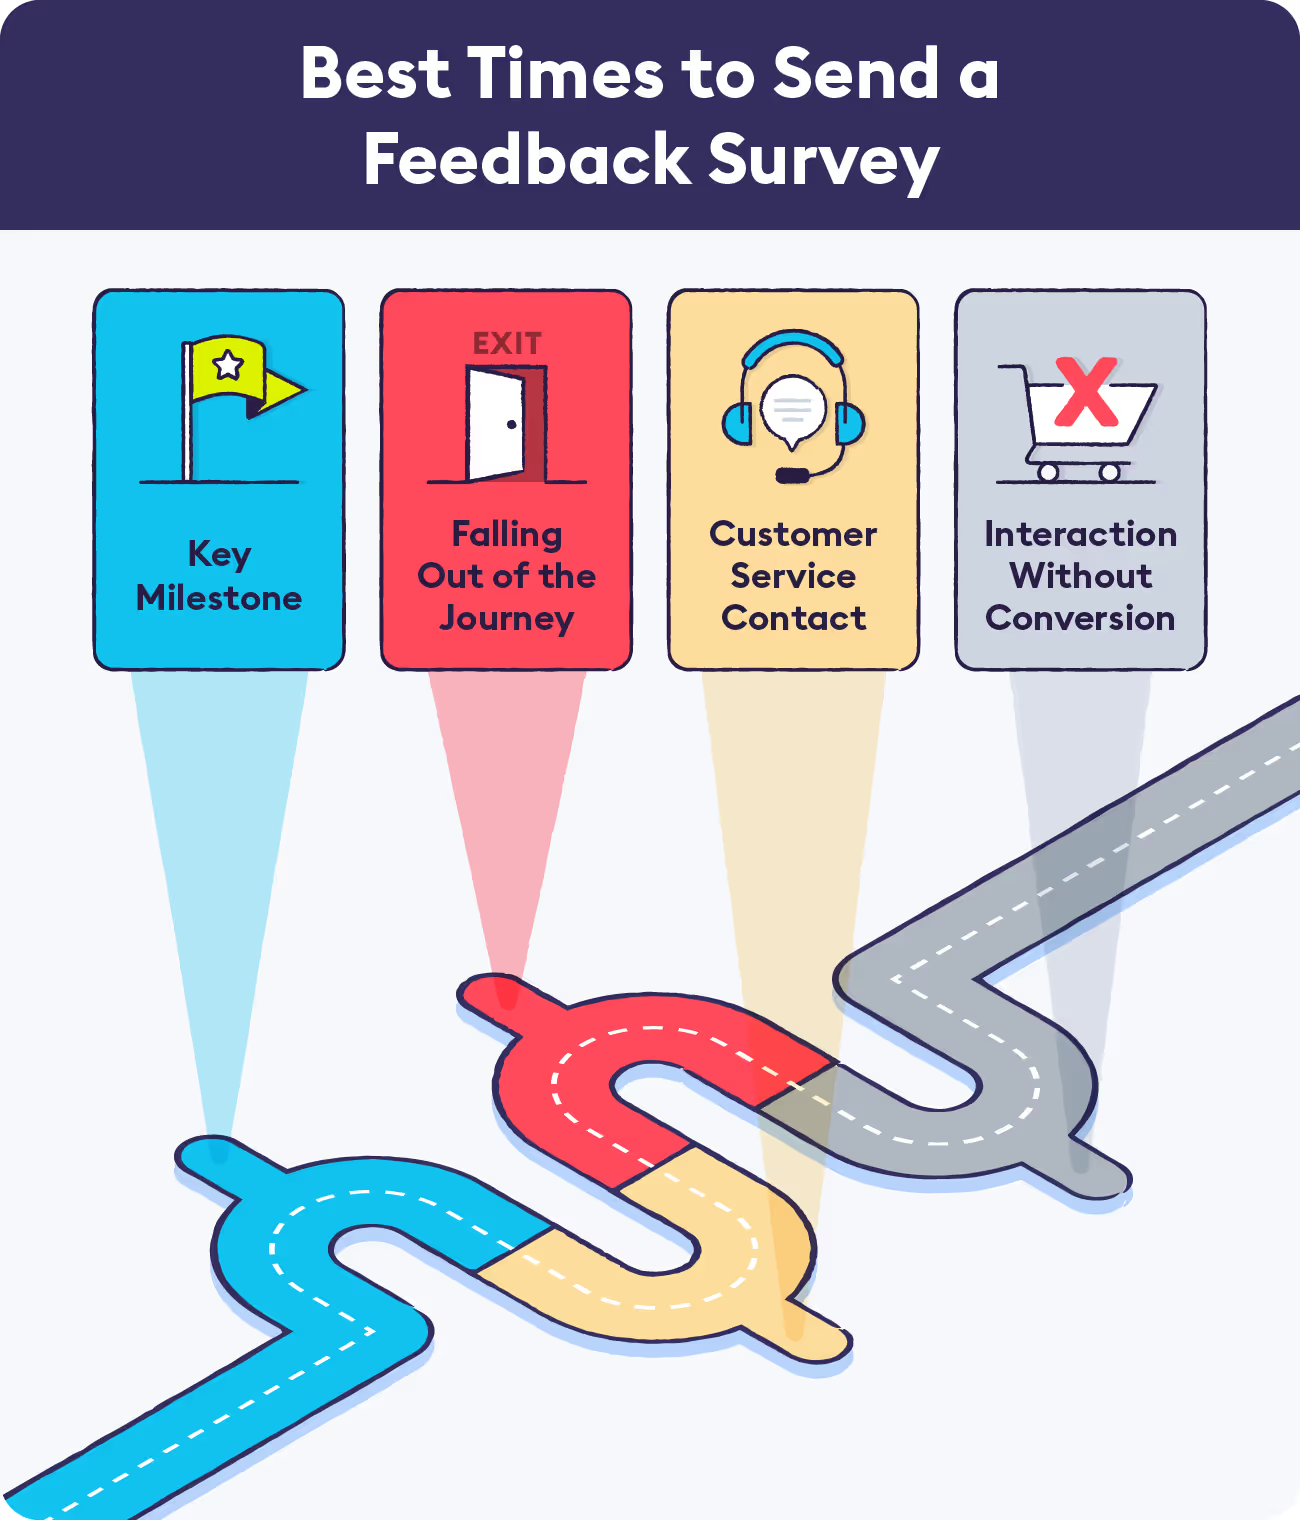
Key Milestone: When a customer hits a key milestone in the customer journey, this presents a great opportunity to gain some valuable feedback about what your company is doing right. For example, after a customer initially signs up you could ask them what led them to choose your company. Or, if a customer is approaching their one-year membership renewal, you can check in with them to make sure everything is going well now that you’ve had a relationship for a while.
Falling Out of the Journey: If a customer cancels their subscription, hasn’t purchased a new product in several months, or some other type of customer churn, you should check in with a customer feedback survey to see if you can gather any insights on what they’re unhappy with. Take a look at our guide to improving customer retention and loyalty.
Customer Service Contact: After someone contacts your organisation, be it through live chat service, a customer service call, or on social media, you may want to gather their feedback about how and if their issue was resolved. Not only will this help you understand why they needed to contact customer support in the first place, but can also identify any shortcomings in your customer service strategy. Read through our piece on social CX to learn more about what brands need to be doing to help customers on social media.
Interaction Without Conversion: This is the classic “abandoned cart” scenario where a customer spends time interacting with your business, but doesn’t actually convert. This can apply to more than failure to purchase a product or subscription, encompassing class or webinar sign-ups, transitioning from a free to a paid product, or whatever your specific conversion metrics are. Sending surveys at this point in the journey can help you understand why the customer didn’t convert, as well as remind them that the product or service is still waiting for them.
It’s important to note that whenever possible, surveys should be sent automatically based on a set of specific triggers, coordinated with the actions above. Having automated surveys can not only make things much easier for your customer service team, but also help to make sure that you’re not over-surveying the same individuals or sending them repeated surveys. Time-based rules and logic can be used as simple ways to avoid annoying customers and to only send surveys at mutually-exclusive touchpoints. Chattermill’s automated customer feedback workflows can help make this process easier.
How to Analyze Survey Data
We’ve finally gotten through all the essential preparation for gathering survey data, so what do we do when we actually have it? Below are five simple steps that any team can take to make sure they’re getting the most from their survey analysis.
1. What Do You Want to Know?
If you’re running a feedback survey, you should at least have some idea of what you’re hoping to get out of your data analysis.
Are you trying to find out why customers are leaving at a certain point in the customer journey, or which products appeal to a certain demographic?
Just like with any research project, you should come up with a set of research questions and a corresponding set of “theses” as answers to those questions.
Then, you can investigate each “thesis” accordingly to either confirm or augment your understanding of that research question.
2. What Do the Variables Tell You?
Now, it’s time to dig in and see what the intersection of demographic and psychographic data points have to tell you.
This is the fun part, where you get to see which cross-sections of people are reacting positively or negatively to your questions. Just remember, each time you drill down further into the data, you’re making the sample size smaller.
Women aged 30-32, who make more than $50K/year and love horseback riding, are going to comprise a small percentage of your overall population.
This is why it’s so important to make sure each data set you’re analyzing remains statistically significant (we’ll get to that later).
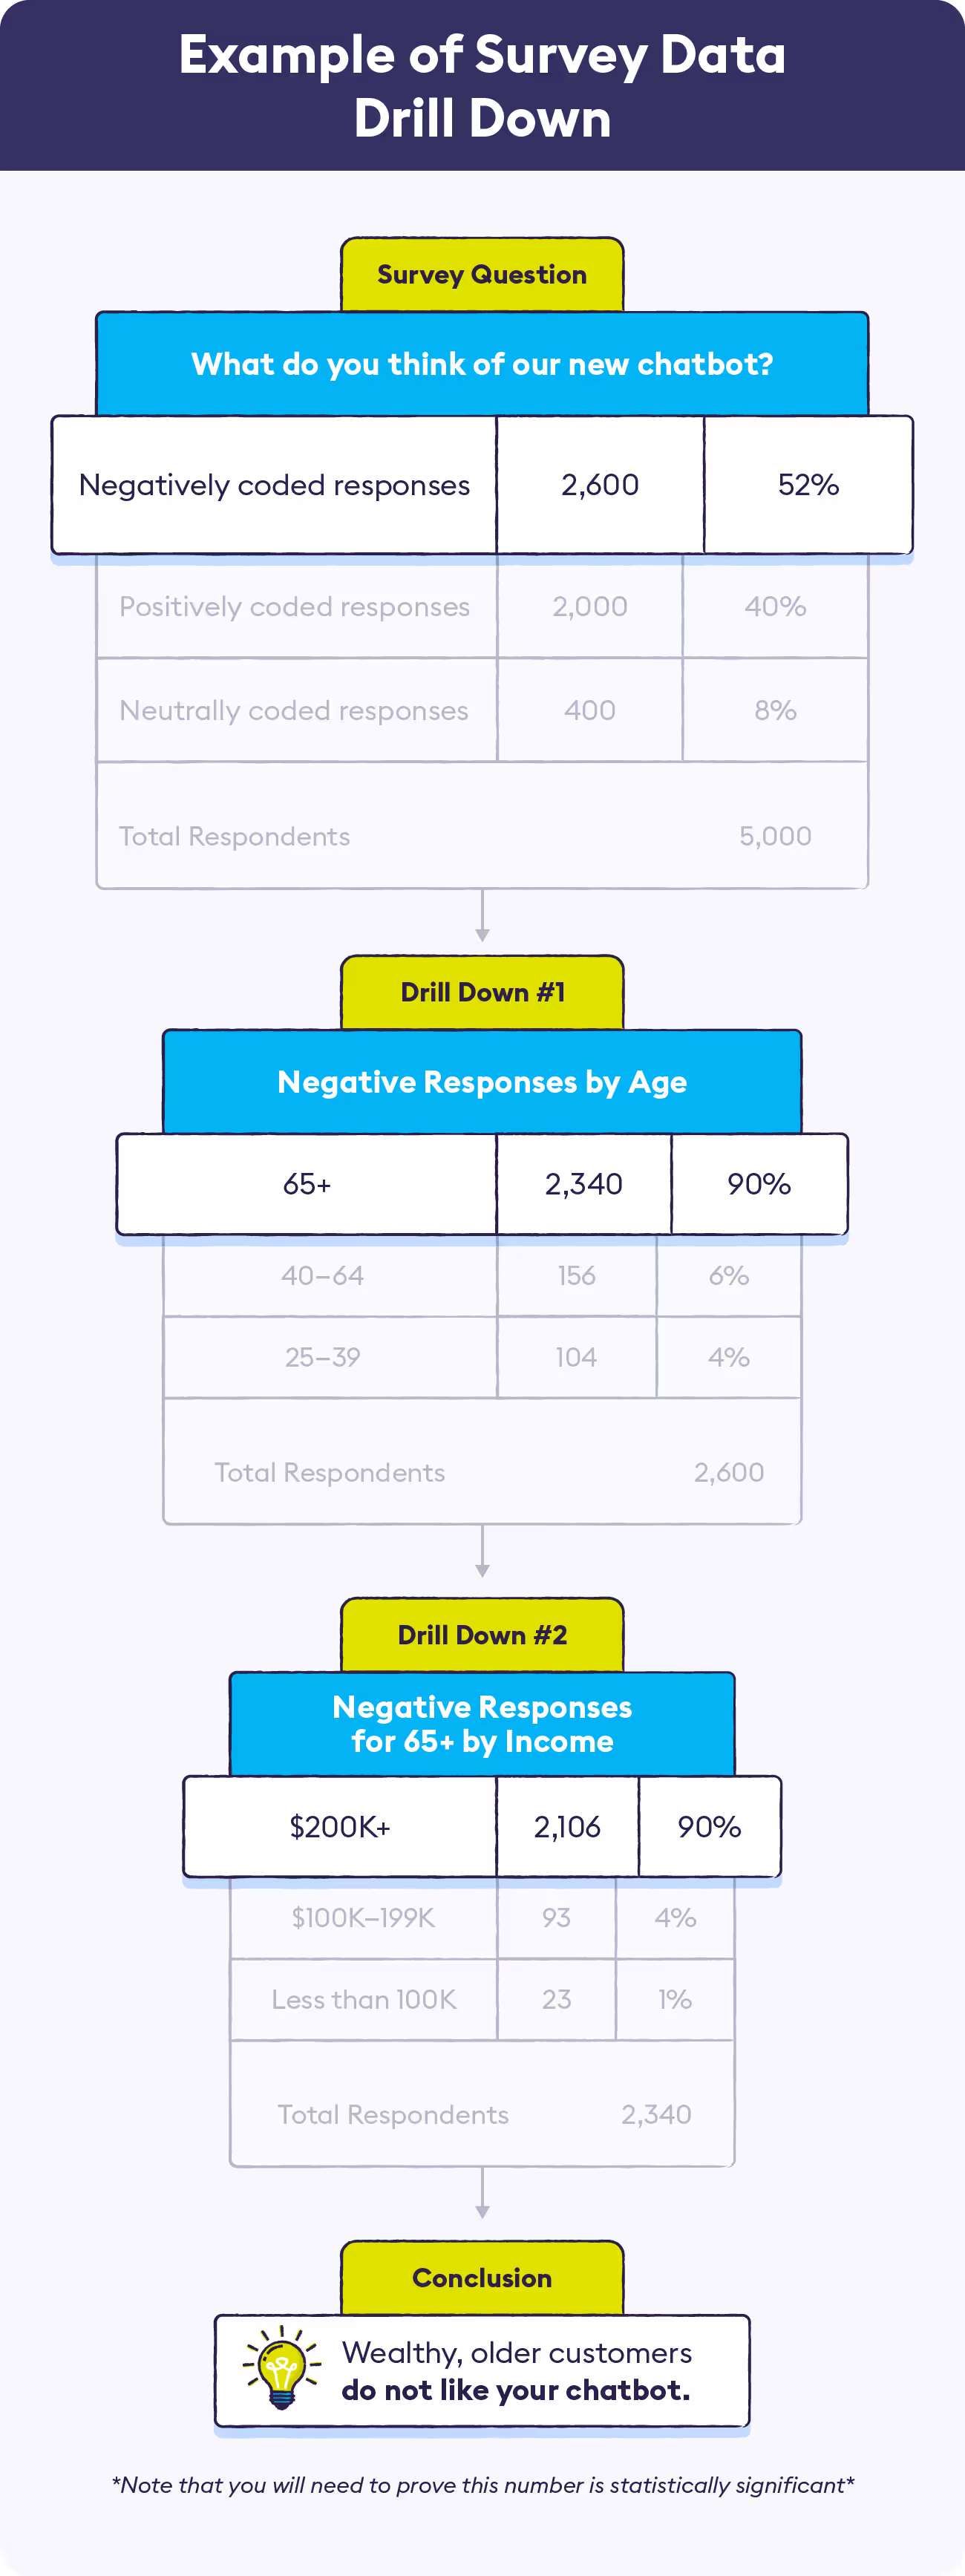
For example, say you asked the question “What do you think of our new chatbot?” Right off the bat, you notice a large percentage of answers that are coded as negative responses.
Then, you drill down into the negative responses, and find that 90% of the negative responders are age 65+.
Looking even further, you see that 95% of negative respondents, age 65+, make an income of over $200K. After making sure that this slice of your data is still statistically significant, you can determine that rich older customers don’t like your new chatbot.
3. Which Patterns Stand Out?
When you dig into the cross-sections of different variables, you will start seeing patterns. These demographic and psychographic patterns are the key to survey data analysis.
When you identify an overall theme or trend within the data, and confirm that the sample you’re looking at remains statistically significant, you can apply that pattern with reasonable confidence to the rest of your audience to draw broader conclusions.
You will want to start looking for patterns that relate to your original research questions and theses, to see if you’re able to confirm any of your initial thoughts.
After that, you can start looking for other high-level patterns, and then drill down further into each pattern to see if you can glean more in-depth insights. Here are a few questions you can use to get started if you’re not quite sure what to look for in your big data set:
- What themes stand out right away? For example, a larger-than-expected amount of negative or positive responses to something.
- How do the responses of young people compare to older people? From men to women? From wealthy to poor? From location to location?
- What are respondents saying about your new product/service?
- Which responses are surprising you? Can you drill down further to figure out any patterns?
- What is the most common positive feedback? What is the most common negative feedback?
Once you go through these questions and start identifying high-level themes within the data, you’ll naturally be able to tell where you need to do more digging, or if you need to run another survey on a specific topic or demographic to gather more data.
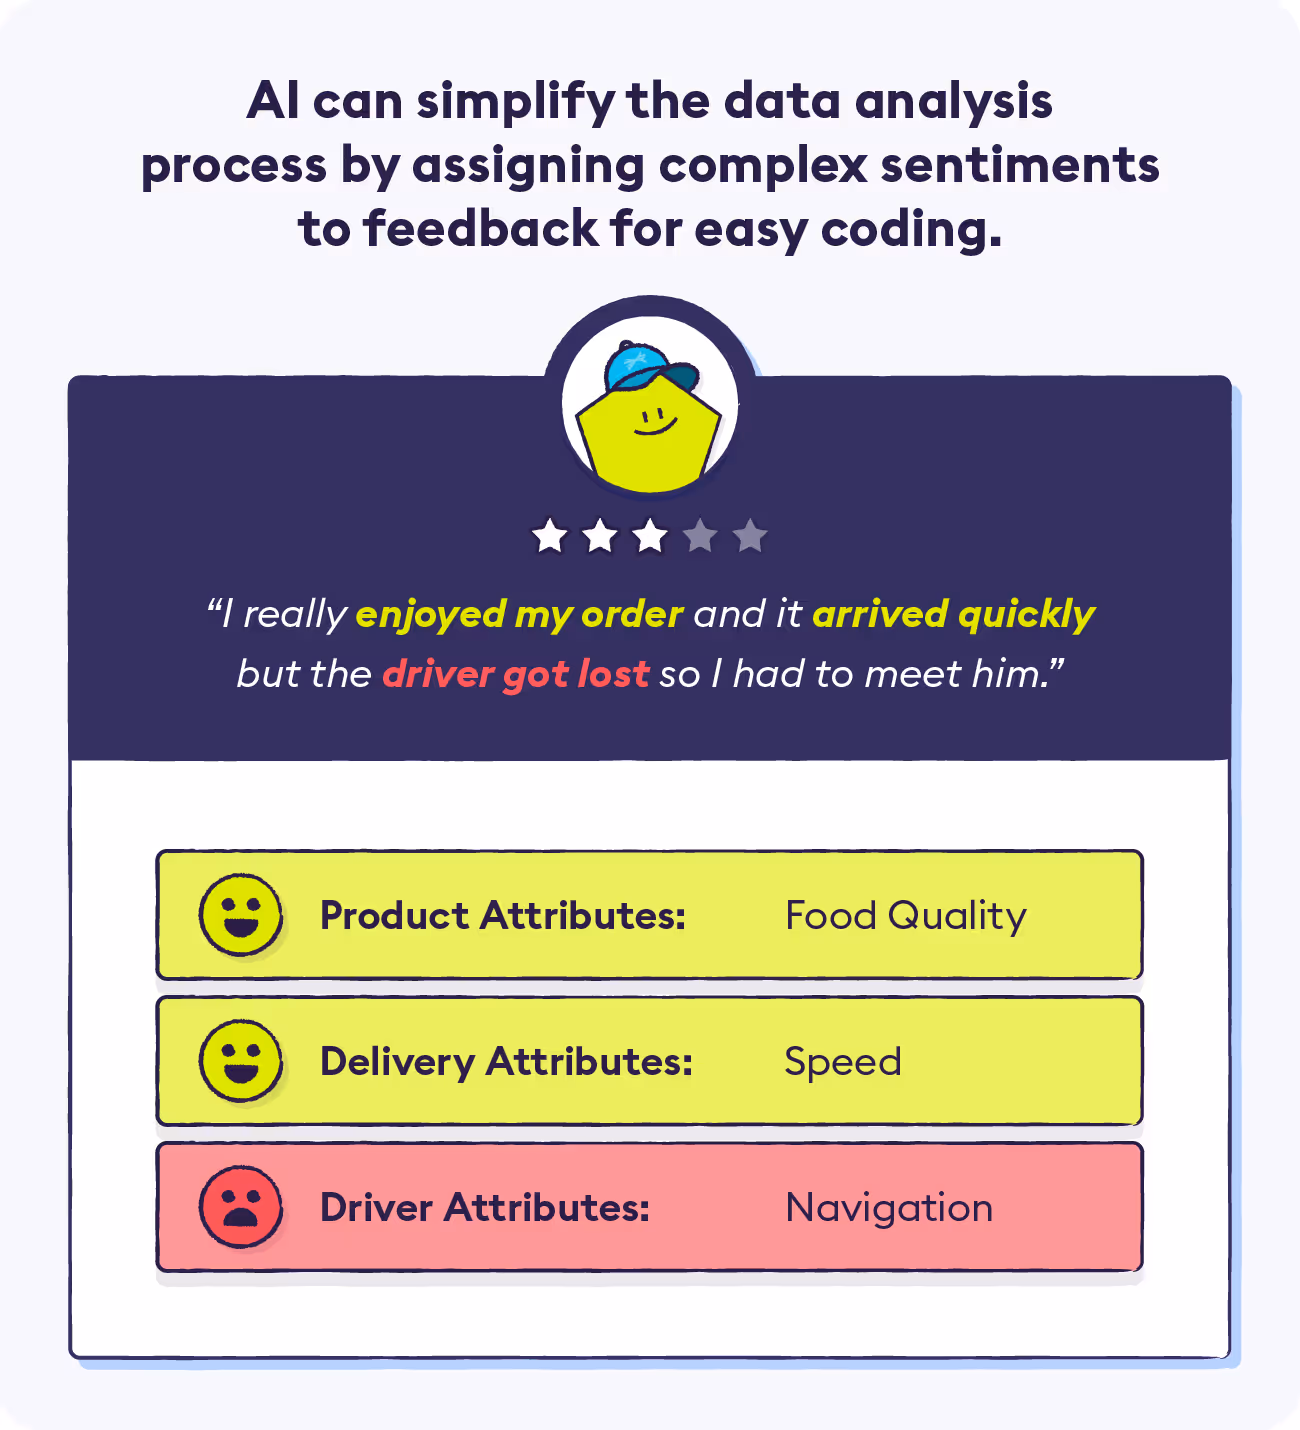
4. Use AI to Scale Survey Data Analysis
Identifying themes at scale can be tough when you begin to grow your customer base. So adding AI into your arsenal of tools can be make a huge impact on your data analysis capabilities.
Try out our insight tagger below with a sample comment from one of your CX or support surveys and get a taste of our theme and sentiment analytics used by Uber, Transferwise, HelloFresh and many big name brands.
5. Is the Data Reliable?
Using raw data with no refinement can lead you to make assumptions about your general customer population that may not actually be accurate.
For that reason, it’s essential to make sure that the data you’ve collected can be used to make assumptions about the wider population. This is known as statistical significance.
In addition to making sure your segment is statistically significant, you should also keep in mind the demographic spread of your surveyed sample and how it compares to your total customer population.
For example, if your customers are spread mostly equally across income levels, but your sample mainly includes households making six figures, your sample is obviously not going to be an accurate representation of the whole when it comes to income level.

There are a number of basic statistical terms and calculations that you should understand in order to make sure your survey data is reliable.
We’ve broken down each equation below, and have provided additional resources for each as well.
You should note that the calculators linked below are mainly useful for understanding the equations themselves, and large-scale analysis will likely need to be done with more complex tools.
Variance: As you might have guessed, variance calculates how widely the data points vary from one another. To find the variance, subtract the mean from each data point, then take each of those numbers and square them. Then, find the mean of all those squared differences.
Standard Deviation: Standard deviation calculates how spread out the data points are from the average. To find standard deviation, take the square root of the variance.
Z-Score: The Z-score shows how many standard deviations (from -3 to 3) a number is from the mean. Z-score is calculated by taking the number, subtracting the mean, and dividing by the standard deviation.
Confidence Level: The confidence level is a percentage indicating how certain you are that your results could be replicated. The industry standard for confidence level is typically 95% or greater. This means that you are confident that 95% of the time, your results could be replicated, and 5% of the time they would not be replicated. For simplicity’s sake, you can easily research your desired confidence level and its corresponding Z-score.
Margin of Error: Margin of error is calculated using the Z-score for your desired confidence level. The equation is the standard deviation, divided by the square root of the sample size, multiplied by the desired Z-score. For example, if your results show that 30% of users don’t like your company’s new branding, and your margin of error comes out to +/- 6% (based on a 95% confidence level), it could actually be anywhere from 24% - 36% of customers who don’t like the new branding.
Statistical Significance: Statistical significance is the likelihood that a result did not happen due to chance. Calculating statistical significance involves setting a null hypothesis (assuming no relationship between the things you’re comparing) and an alternative hypothesis (trying to prove a relationship between the things you’re comparing). Then, you use the variables above to determine if your hypothesis meets the 5% or less threshold (corresponding to the 95% confidence level). There are a number of complicated ways to calculate statistical significance, but luckily many calculators and free A/B tests are available to help you understand the process.
6. What Do You Do With the Results?
You’ve carefully constructed your survey to avoid response bias, sent it out and gathered feedback, identified patterns and insights within the data and ensured it’s statistically significant, so now what?
Now, you compile your takeaways and generate hypotheses as to how you can address these issues. Your new hypotheses may or may not be the same as your original “theses.” Maybe you were able to back up your original theories with data, or you discovered that the causes of a particular response are actually nothing like what you originally thought.
Collaborate and communicate across teams to validate your hypotheses. See if customer service reps have noticed similar complaints on client phone calls, or if social media managers deal with the same issues on their end. It’s important for all teams to contribute to these ideas, as an obvious fix to one team may be problematic for another.
Once your teams are aligned, you can start implementing changes that address your survey feedback.
Perhaps you found out that your younger audience found frequent email contact annoying, so you scale back your email marketing targeting that demographic. Or maybe your data revealed that enterprise-level clients found a particular feature of your software difficult to use, so you work on updating that feature based on their feedback.
After you’ve implemented these changes, you can re-survey your audience to see if your changes have been successful, and to learn about any other issues that need to be addressed.
And, so on and so forth! The value of survey data analysis is that you’ll always be able to work on improving your offerings and measuring results in order to stay ahead of the competition. By using AI to conduct your surveys, you can simplify this process by sending and analyzing data at scale.
AI allows questionnaires to be shorter without sacrificing valuable insight or bogging down your employees with endless work.
Book a Chattermill Demo to learn about how our Customer Feedback Platform can help inform your survey analysis strategy.
Survey Data Analysis: FAQs
What is survey data analysis?
Survey data analysis is the process of examining responses from surveys to uncover patterns, trends, and insights. It involves both quantitative data, such as numeric ratings, and qualitative data, such as written feedback.
Why is survey analysis important?
Analyzing survey data transforms raw responses into meaningful insights. It helps organizations identify customer needs, spot trends, and make informed decisions to improve products, services, or experiences.
What are demographic and psychographic variables?
- Demographic data refers to measurable traits like age, gender, income, or location.
- Psychographic data reflects values, interests, attitudes, and opinions.
Together, they provide a fuller picture of customer behavior and motivations.
What are best practices for collecting accurate survey data?
To ensure reliable analysis, use consistent metrics across surveys, ask clear and unbiased questions, and keep response options standardized. This makes it easier to compare results over time and across different groups.
How do you analyze survey results effectively?
Effective analysis involves identifying key patterns, comparing different groups, and ensuring the data is statistically significant. It’s also important to balance numerical insights with the context provided by open-ended responses.
Can AI help with survey data analysis?
Yes. AI tools can automatically detect themes and sentiments in open-ended responses, making it easier to analyze large datasets. This speeds up the process while preserving deeper insights that might be missed with manual review.
What is the difference between quantitative and qualitative survey analysis?
Quantitative survey analysis focuses on numbers and measurable data, such as ratings or counts. Qualitative survey analysis explores open-ended feedback to understand emotions, motivations, and the reasons behind the numbers.