What is a Good NPS Score? Improve Your Net Promoter Score


The CX intelligence
platform that's AI-native by design
Book a demoA company’s success can be impacted by the power of a deceptively simple question: How likely is it that you would recommend [Company X]? The responses to this singular question are the basis for a business’ Net Promoter Score (NPS), a quantifiable method of measuring and tracking customer satisfaction through a basic survey, here is our free nps survey template, identifying its promoters and detractors. In fact, according to Forbes, 45% of US companies use the NPS to measure their customers' loyalty.
The popular scoring metric offers a broad overview of any company’s overall customer satisfaction, providing opportunity for growth in both loyalty and revenue. Below, we discuss exactly what is a good NPS score, how you can measure against industry benchmarks, and suggest ways to improve your NPS score to better address address customer pain points.
How is NPS Score Calculated?
The NPS score is calculated using the following steps:
- Customers rate their likelihood to recommend on a scale of 0-10.
- Responses are categorized: Promoters (9-10), Passives (7-8), and Detractors (0-6).
- Calculate the percentage of Promoters and Detractors.
- Subtract the percentage of Detractors from the percentage of Promoters.
The formula is: NPS = % Promoters - % Detractors
For a shortcut, you can use Chattermill’s NPS Calculator for free.
Example NPS Score Calculation
For example, if 50% are Promoters, 10% are Detractors, and 40% are Passives, the NPS would be 50 - 10 = 40. The final score ranges from -100 to 100, with Passives not directly impacting the calculation.
The NPS Question and Scale
The NPS question is typically phrased as: "On a scale of 0 to 10, how likely are you to recommend our company/product/service to a friend or colleague?" This simple question is designed to gauge overall satisfaction and loyalty.
The 0-10 scale is crucial:
- 0-6: Detractors - Unhappy customers who might damage your brand through negative word-of-mouth
- 7-8: Passives - Satisfied but unenthusiastic customers who are vulnerable to competitive offerings
- 9-10: Promoters - Loyal enthusiasts who will keep buying and refer others
Categorizing Respondents: Promoters, Passives, and Detractors
Understanding these categories is key to interpreting your NPS:
Promoters (9-10)
These are your brand ambassadors. They're not just satisfied; they're enthusiastic about your product or service and likely to recommend you to others. Promoters have the highest customer lifetime value and account for most referrals.
Passives (7-8)
While satisfied, these customers lack the enthusiasm of promoters. They're vulnerable to competitive offerings and unlikely to spread either positive or negative word-of-mouth. Focusing on turning passives into promoters can significantly boost your NPS.
Detractors (0-6)
These unhappy customers can damage your brand and impede growth through negative word-of-mouth. They're also likely to have a high churn rate. Understanding and addressing the concerns of detractors is crucial for improving your NPS.
What is a Good NPS Score?
Defining a "good" NPS score isn't as straightforward as it may seem. It's always best if your NPS is over 0, as anything in the negative range indicates that you have more frustrated customers than happy ones. However, gauging the quality of your NPS is really all about comparison—to your industry average, to your competitors, and to your previous scores.
NPS Score Ranges and Their Meanings
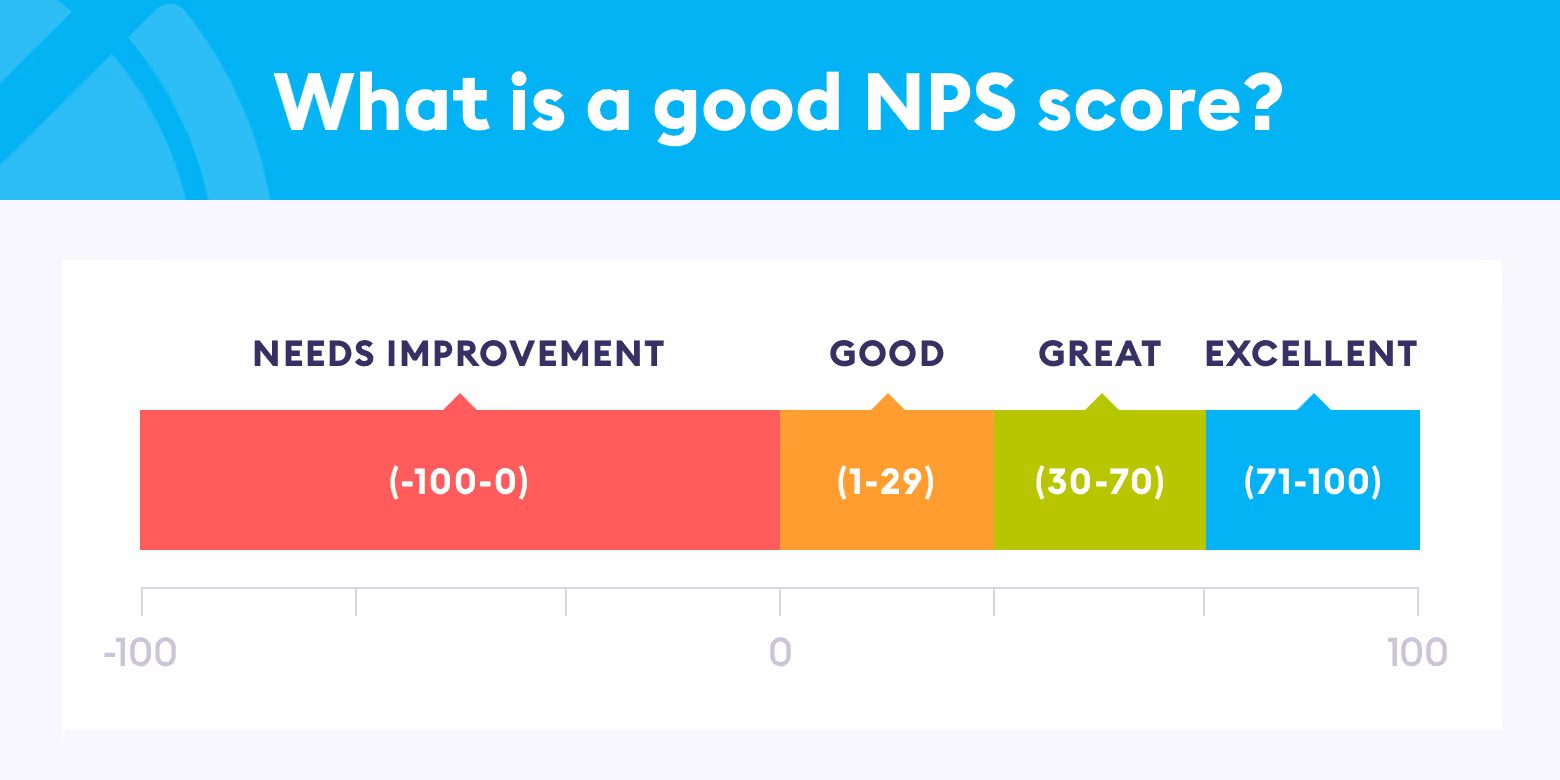
In broad terms, net promoter scores can be broken up into four general ranges:
- Below 0: Any negative number shows that you have more detractors than promoters, indicating your customer experience performance needs urgent improvement.
- 0–30: Being above 0 is a good place to be and reveals that you have more promoters than detractors. Companies in this range should feel positive about their position but recognize they should actively be working to continually improve customer service.
- 30–70: A score in this range is a strong showing, with a good base of loyal and happy customers. This is the range to strive for overall.
- Over 70: The love for your company is tangible and reflects the power of promoters' positive word-of-mouth referrals, leading to faster growth and increased revenue.
Keep in mind that some industries have an average NPS that never passes 20, so knowing your industry benchmarks is an important factor to judging where you fall on the scale of -100 to 100. You should think about your business’ NPS as a competition against yourself—always competing to improve your latest score over your previous score. Context is key in truly understanding your NPS and what it says about your company.
Industry-Specific NPS Benchmarks
It's crucial to understand that NPS benchmarks can vary significantly across industries. For example:
- Technology: Companies like Apple and Netflix often score in the 50-70 range.
- Retail: Top performers like Amazon and Costco typically score in the 60-70 range.
- Airlines: Scores tend to be lower, with leaders scoring in the 30-40 range.
- Telecommunications: This industry often has lower scores, with leaders in the 20-30 range.
.avif)
Interpreting Your NPS Score
What a Positive NPS Score Means for Your Business
A positive NPS (above 0) indicates that you have more promoters than detractors, which is a good starting point. It suggests that:
- You have a base of satisfied customers who are likely to recommend your business.
- Your customer experience is generally positive.
- You have potential for organic growth through word-of-mouth marketing.
However, the goal should always be to improve your score, regardless of whether it's positive or negative.
What Happens If You Have a Negative NPS Score?
If you are faced with a negative NPS, it's time to acknowledge that you have work to do. Criticism is never fun to receive, but it can hold tremendous value. Your customers have now given you direct communication of their overall frustration with the customer experience they've received, and you must take action to help your business improve.
Take the time to dive into the specifics of the comments you've collected to determine your biggest trouble spots. Then, review your current practices and reevaluate how you can adjust them to better serve your customers. Know that changing the minds of customers can take time, but consistent efforts to address and improve the targeted problem areas can help your NPS grow.
The Importance of NPS Trends Over Time
While a single NPS measurement provides valuable insight, tracking your NPS over time is even more crucial. This allows you to:
- Identify trends in customer satisfaction
- Measure the impact of customer experience initiatives
- Predict future business performance
A consistently improving NPS suggests that your customer experience strategies are working, while a declining NPS may indicate underlying issues that need to be addressed.
Why Do Benchmarks Affect Your NPS Score?
Your business does not operate in a vacuum. Unsurprisingly, the true value of the net promoter score cannot be fully achieved without understanding multiple contextual factors that surround your rating.
Industry - Knowing the average NPS of your industry serves as a valuable benchmark in understanding your own NPS. Some industries, such as internet service (NPS 2) and health insurance (NPS 18) have low benchmarks. So, if you're an internet service provider with a score of -4, you're actually not ranking far from the industry average even though you're in the negative.
Geography - The location of your customer base can be an important factor. Customer sentiment in some parts of the world tends to be more conservative or reserved. Many European and Asian countries produce scores that lean toward the lower range, as effusive praise can be seen as a negative. Americans, on the other hand, are known for providing typically higher scores than the rest of the world.
Niche Targets - If yours is a niche customer base, keep in mind that their expectations may differ from those of the general market. Your survey respondents might be more engaged and provide more detailed feedback if you're targeting educators as opposed to targeting accountants.
Survey Channels - Consider which feedback channels you're using to conduct your surveys: email, SMS, in-app? The method(s) you use can also impact the engagement of your customers based on how much time they're willing to invest on their device.
How Can You Improve Your NPS Score?
Once your company's current NPS score has been determined, it's time to take action to help your score move upward. No matter what score you've earned—it could be -14, 56, or 90—you should always strive to improve your NPS, as it is one of the top customer satisfaction metrics you should be tracking to best support your enterprise. Below are strategies you can put in place to grow your score. For a full comprehensive breakdown on strategies to improve your Net Promoter Score, check out are article here.
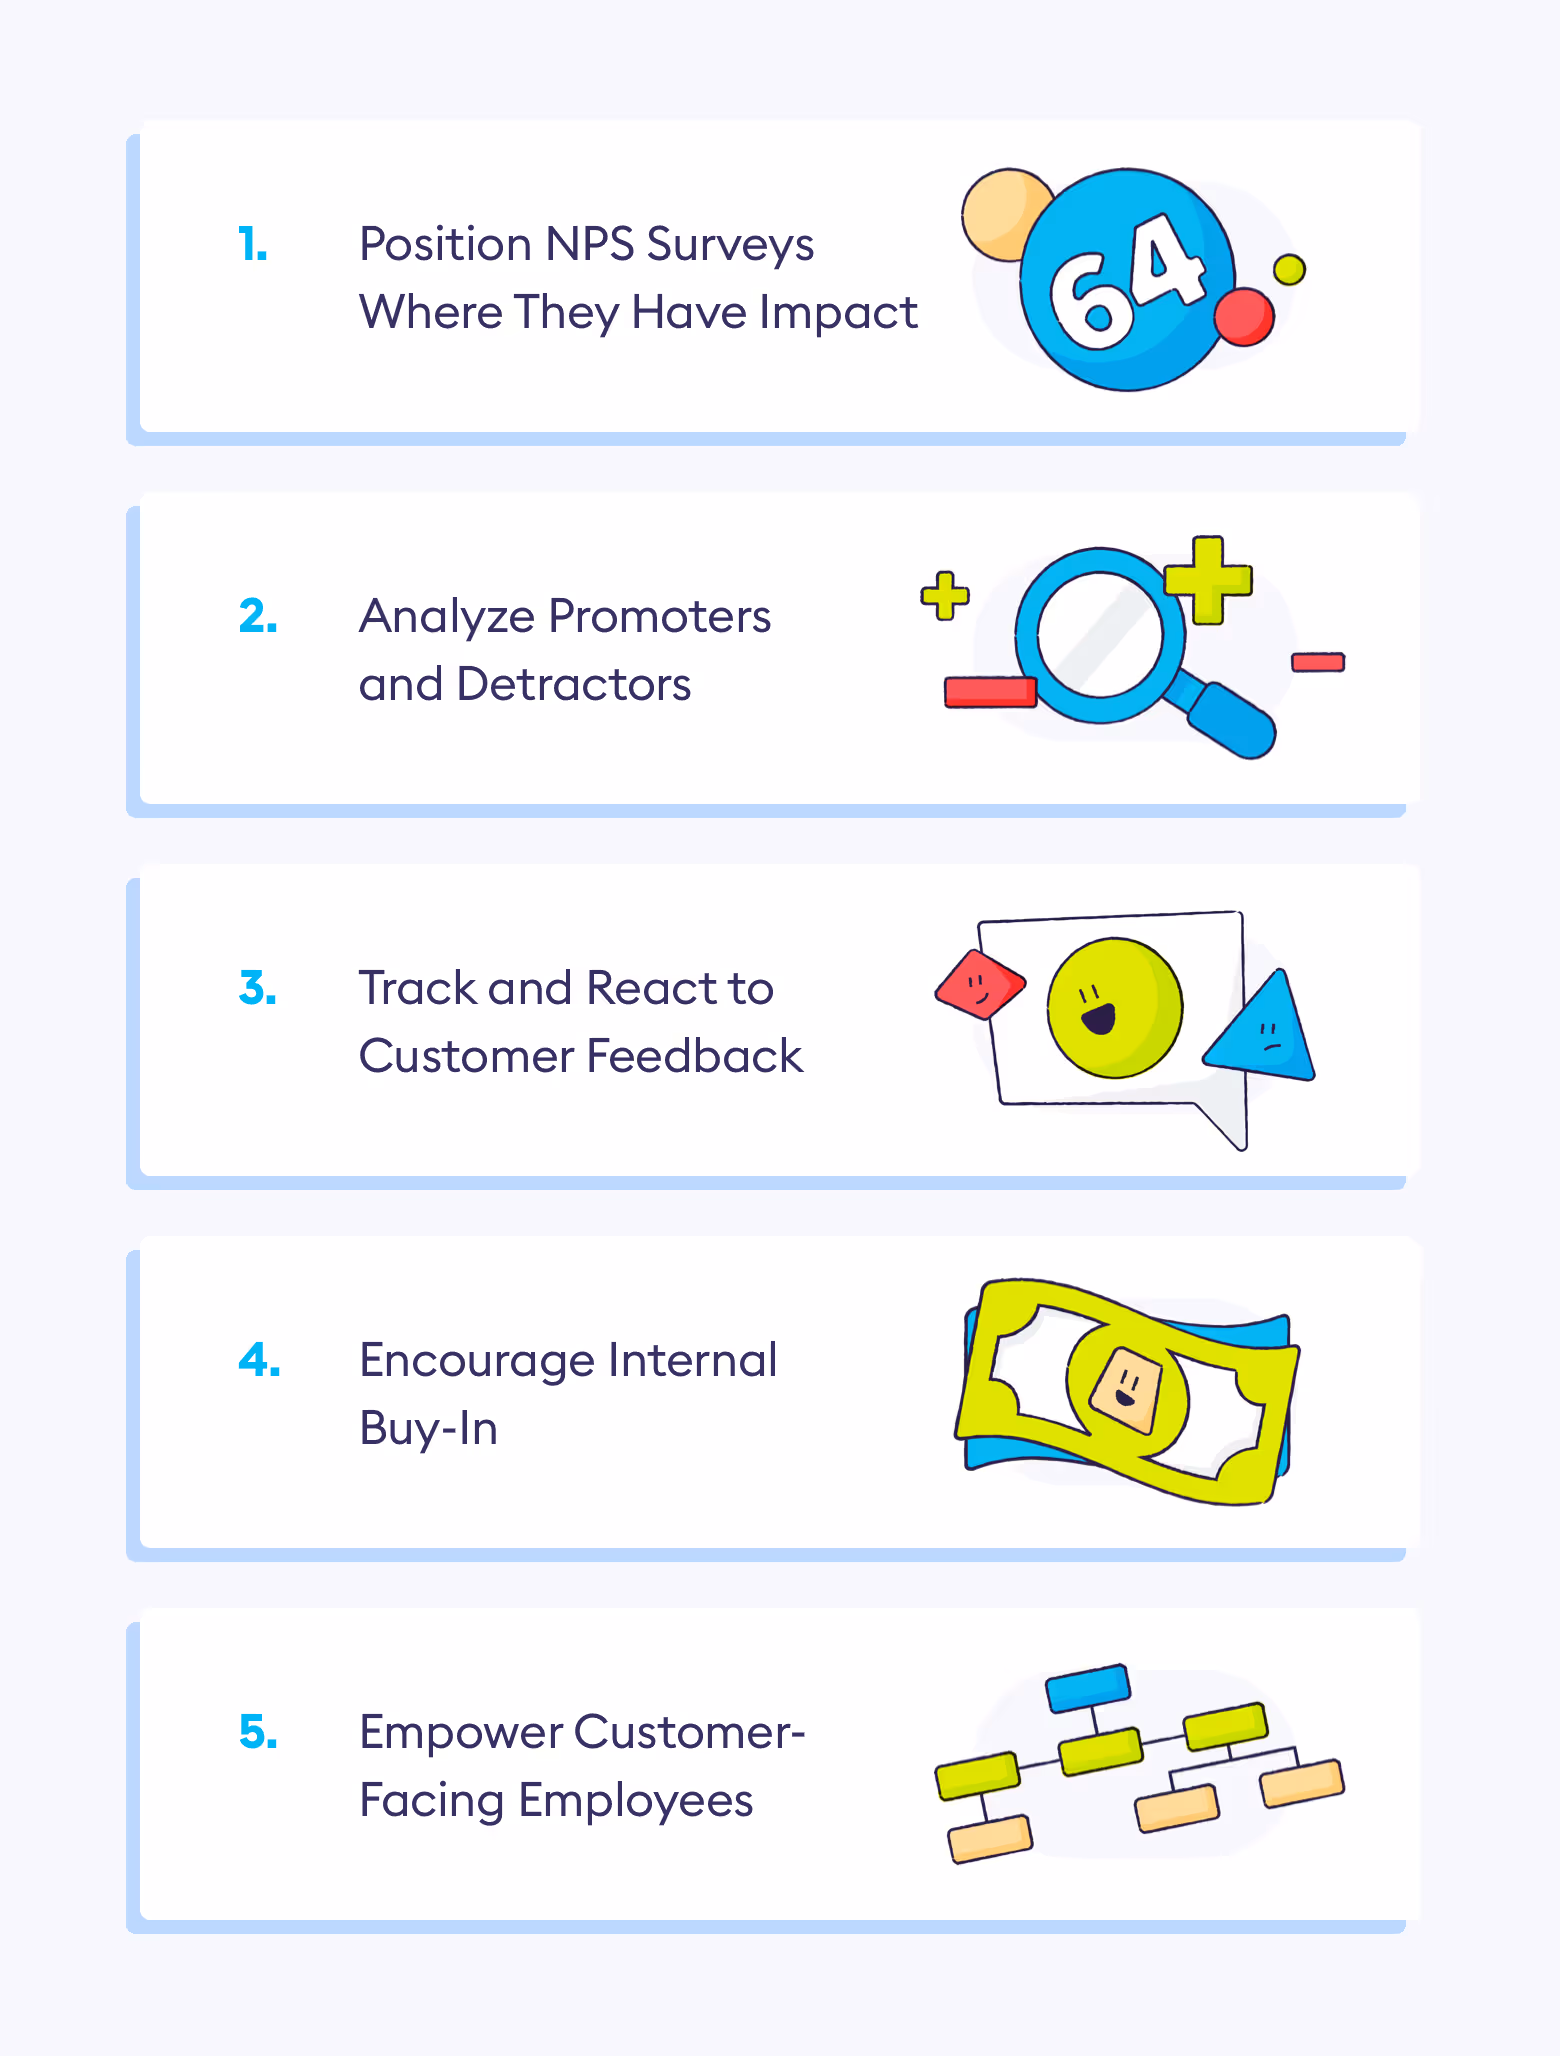
1. Position NPS Surveys Where They Have Impact
To maximize your response rate for NPS surveys, provide multiple feedback channels. Think about where and how you offer your NPS surveys. Consider trying transactional NPS (TNPS) surveys, which are sent directly after a customer interacts with a business. Also, in-app outreach tends to receive higher response rates, but email engagement often leads to deeper feedback that explains their scoring choice. Keep in mind, the more insight you receive from your customers, the more you can drill down to the specifics of what areas need improvement.
2. Analyze Promoters and Detractors
Understanding the insights offered by your biggest fans - your promoters - is critical to making them feel heard and valued. Not every promoter offers 100% positive comments, so it's critical to listen to their thoughts to keep them as your cheerleader. And while receiving critical feedback is never fun, knowing the "why" behind your detractors' opinions offers opportunities for improvement and potential for converting them into promoters.
3. Track and React to Customer Feedback
One simple NPS survey will not provide enough data to help your business. It's important to conduct surveys regularly to continually track your customer service performance. When updating your data analysis with each survey, it's important to determine the actionable themes and details that need work. Reviewing the nuances of what made the promoters' experiences positive and what issues the detractors experienced will allow for a more thorough understanding of each customer's experience.
4. Encourage Internal Buy-In
Make sure that each of your employees understands that their performance can impact the customer experience, even if they never engage directly with a customer. Train them to consider the ripple effect of their personal impact on each customer, empowering them to adjust their own choices to best benefit the customer and the company.
5. Empower Customer-Facing Employees
A single bad customer experience can transform a promoter to a detractor, so efforts to ensure the quickest and most effective customer service have a direct impact on your NPS. Providing your customer-facing team with useful informational resources and investing in top-notch training to meet every customer's needs will set them up for success.
For more ways to improve your NPS score, check out our article on the 9 ways to Improve Your Net Promoter Score.
NPS Best Practices and Common Pitfalls
Frequency of NPS Surveys
Finding the right frequency for your NPS surveys is crucial. Too frequent, and you risk survey fatigue; too infrequent, and you might miss important shifts in customer sentiment. Generally, for B2C companies, conducting NPS surveys quarterly is a good practice. For B2B companies with longer sales cycles, bi-annual or annual surveys might be more appropriate. Always consider your customer's journey and touchpoints when deciding on survey frequency.
Combining NPS with Other Customer Experience Metrics
While NPS is a powerful metric, it shouldn't stand alone. Combine it with other customer experience metrics for a more comprehensive view:
- Customer Satisfaction (CSAT): Measures short-term satisfaction with a specific interaction or product.
- Customer Effort Score (CES): Assesses how easy it is for customers to do business with you.
- Customer Lifetime Value (CLV): Helps you understand the long-term value of retaining promoters.
By combining these metrics, you can get a more nuanced understanding of your customer experience.
Avoiding Bias in NPS Data Collection
To ensure your NPS data is reliable and actionable, avoid these common biases:
- Selection bias: Ensure you're surveying a representative sample of your customer base, not just your most engaged customers.
- Response bias: Be careful not to incentivize responses in a way that might skew results.
- Timing bias: Consider when you're asking for feedback – immediately after a purchase might yield different results than asking during a support interaction.
Real-World Examples: Companies with Exceptional NPS Scores
Several companies have achieved impressive NPS scores through their commitment to customer experience:
- Tesla (NPS Score = 96): A whopping 91% of Tesla owners said they would buy from Tesla again, indicating the strength of customer loyalty reflected by this impressive NPS.
- Costco (NPS Score = 79): Costco's membership-based structure is well-served by its high NPS, achieved through reliable products and pricing, fast services, and happy employees providing top-notch customer service.
- Starbucks (NPS Score = 77): The reliability of quality and consistent customer service combined with a loyalty program that is used by a large share of their customers is illustrated by Starbucks' score.
- Netflix (NPS Score = 68): Customer loyalty is so strong at Netflix that 80% of their subscribers do not use any other additional streaming services.
- Amazon (NPS Score = 62): Single sign-on services, simple and efficient customer service resolutions, and access to free shipping through their paid Prime memberships make Amazon a reliable high-scorer.
.avif)
Case Studies of NPS Success Stories
Let's look closer at two of these success stories, Costco and Netflix.
Costco
The warehouse giant's high NPS is a result of its customer-centric approach. They focus on providing high-quality products at competitive prices, coupled with excellent customer service. Their membership model creates a sense of exclusivity and value, while their liberal return policy demonstrates trust in their products and customers. By consistently meeting and exceeding customer expectations, Costco has built a loyal customer base that actively promotes the brand.
Netflix
Netflix's success in NPS is driven by its personalized user experience and content recommendation system. By leveraging data analytics to understand viewer preferences, Netflix can provide a tailored experience for each user. Their continuous investment in original content keeps the platform fresh and engaging. Moreover, their easy-to-use interface and ad-free viewing experience contribute to high customer satisfaction, translating into a strong NPS.
Advanced NPS Analysis Techniques
Segmenting NPS Data for Deeper Insights
To extract maximum value from your NPS data, consider segmenting it by:
- Customer demographics (age, location, etc.)
- Product or service type
- Customer tenure
- Purchase frequency
- Support interactions
This segmentation can reveal patterns and insights that might be hidden in aggregate data. For instance, you might find that long-term customers have a higher NPS, or that customers who've recently interacted with support have a lower NPS.
Predictive Analytics and NPS: Forecasting Customer Behavior
By combining NPS data with other customer metrics, you can use predictive analytics to forecast future customer behavior. For example:
- Churn prediction: Customers with low NPS scores might be at higher risk of churn.
- Upsell opportunities: High NPS scores might indicate customers who are more likely to be receptive to upsell or cross-sell offers.
- Referral potential: Customers with the highest NPS scores are your best candidates for referral programs.
How AI and Machine Learning Enhance NPS Analysis (Chattermill's Unique Approach)
At Chattermill, we leverage advanced AI and machine learning techniques to take NPS analysis to the next level:
- Sentiment Analysis: Our AI can analyze open-ended feedback to understand the sentiment behind the scores, providing context and actionable insights.
- Theme Extraction: Machine learning algorithms can identify common themes in feedback, helping you understand the key drivers of your NPS.
- Predictive Modeling: By analyzing historical NPS data alongside other customer metrics, we can predict future NPS trends and identify factors most likely to impact your score.
- Real-time Analysis: Our platform provides real-time NPS analysis, allowing you to respond quickly to changes in customer sentiment.
- Multi-language Support: Our AI can analyze feedback in multiple languages, providing global insights for international businesses.
Conclusion for Maximizing the Value of Your NPS Program
Understanding your Net Promoter Score is a valuable asset in strategizing your company's future because customer loyalty can make or break you. But the score alone is not the answer. Context is key when evaluating your NPS results.
Remember these key points:
- A good NPS score is relative to your industry, geography, and previous performance.
- Regularly track and analyze your NPS to identify trends and areas for improvement.
- Use NPS in conjunction with other customer experience metrics for a comprehensive view.
- Leverage advanced analytics and AI to extract deeper insights from your NPS data.
- Always act on the feedback you receive – showing customers that their voice matters can itself improve loyalty.
By following these principles and continuously striving to improve your customer experience, you can drive your NPS higher, leading to increased customer loyalty, positive word-of-mouth, and ultimately, business growth.
Remember, the goal isn't just to achieve a high NPS, but to create a customer-centric culture that naturally results in satisfied, loyal customers who are eager to promote your brand. With the right approach and tools, your NPS can become a powerful driver of business success.
What Is a Good NPS Score?: FAQs
What is Net Promoter Score (NPS) and why does it matter for my business?
Net Promoter Score (NPS) is a loyalty metric ranging from -100 to +100 that measures how likely customers are to recommend your brand to others. It’s valuable because it offers a clear, actionable signal of customer loyalty and word-of-mouth potential.
What general NPS ranges indicate positive, good, great, or exceptional performance?
Generally, any NPS above 0 is positive, showing more promoters than detractors. A score between 0 and 30 is considered good, 30 to 70 is great, and anything above 70 is exceptional—indicating strong customer advocacy.
Why is industry context important when interpreting your NPS?
Different industries have different average NPS expectations—technology companies may score 50-70, while airlines might range from 30-40. So, your score’s value depends on how you compare to peers in your industry.
How should I interpret a negative NPS?
A negative NPS means you have more detractors than promoters, signaling urgent need to improve customer experience and satisfaction levels.
Should I compare my NPS to competitors or my past performance?
Both approaches are important. Comparing to industry benchmarks helps assess relative strength, while tracking your own NPS trend over time shows whether your customer experience efforts are working.
How are “promoters,” “passives,” and “detractors” defined in NPS surveys?
Promoters are customers who rate 9–10, passives rate 7–8, and detractors rate 0–6 on how likely they’d be to recommend your business. NPS is calculated by subtracting the percentage of detractors from the percentage of promoters.
What makes an NPS score world-class?
Scores above 80 are considered world-class. Earning this level implies exceptional customer loyalty and a strong brand reputation.
Is increasing my NPS over time more important than the absolute value?
Yes. Ongoing improvement signals that your customer experience strategies are delivering results and fostering loyalty—even if your score isn’t the highest in your industry yet.
What should I focus on if my NPS isn’t where I’d like?
Start by analyzing verbatim feedback—especially from detractors—to identify key pain points. Use those insights to guide targeted improvements in products, support, or experience.


CX intelligence
for teams and agents
Book a meeting


COMPARISONS
Chattermill Analytics Limited
68 Hanbury St, London, E1 5JL,
United Kingdom