One of the most important aspects of a company’s revenue is customer satisfaction and loyalty. One of the best ways to measure customer satisfaction and loyalty is through a customer satisfaction survey methodology known as Customer Effort Score (CES).
Corporate Executive Board (CEB Global, now Gartner) developed CES in 2010. CEB found that the volume of effort consumers put in when interacting with brands has a strong correlation with loyalty levels. In fact, “96% [of customers] who had high-effort experiences reported being disloyal, compared to only 9% of customers with a low-effort experience.”
In the below guide you will gain a better understanding of what CES is, when and how to measure it, and its relationship with Net Promoter Score (NPS).
What is Customer Effort Score (CES)?
Customer Effort Score (CES) is a metric from surveys that measures the effort customers face in resolving issues with a business. It reflects satisfaction levels and is applicable in scenarios like customer support, demo use, or purchases.
CES surveys will often ask one question or make a singular statement framed around effort level that the surveyee must respond to on a scale starting at one and going up to 10. For example, “How difficult was it for you to resolve your issue today?” or “Please rate the difficulty of using our product.”
Why Customer Effort Score Matters
As a company, you want your customers to experience low effort and ease when interacting with your brand. A low CES is a strong indicator that a customer will stay with or purchase again from a company. Additionally, a low CES can also translate to positive organic media or word-of-mouth traffic. While a high effort score can lead to customers churning and even bad-mouthing your company.
Examples of high effort situations for customers typically consist of having to be transferred to multiple departments, switching modes of communication (email to phone), or having difficulty with a company's online interface.
Your Customer Effort Scores relay key data and insight into specific bottlenecks or difficulties that your customers face when interacting with your company. These negative experiences can then be fixed and mitigated by better training your customer experience (CX) team or in-store employees, or by fixing software bugs and issues.
When to use Customer Effort Score vs other CX metrics
There are three primary customer service metrics that businesses often rely on: Net Promoter Score (NPS), Customer Satisfaction (CSAT), and Customer Effort Score (CES). Each of these metrics provides valuable insights that can work in harmony with one another. It's essential for your organization to engage in experimentation and analysis to determine which combination of these metrics will best serve your specific needs and objectives.
You want to be strategic about your customer satisfaction surveys. Consumers don't always like to fill out surveys unless they are on an extreme end of the satisfaction spectrum — either a company went beyond expectations or the service did not go well. Below are incidences when you should implement a customer satisfaction survey to get a Customer Effort Score.
Following an interaction with a product, demo, or trial
After a consumer uses your product or service, you want to turn them into a repeat customer. One way to increase the acquisition rate is to understand and fix issues or difficulties clients experienced during a demo or trial period.
Directly after with customer service
Once someone finishes interacting with a customer service representative, send an email or ask the customer to stay on the line for a quick survey. This way, you can collect real-time unfiltered feedback.
After an interaction that led to a purchase
Your purchasing process can be improved by requesting direct feedback once someone pays for a service or product. After implementing this feedback you will likely increase the number of consumers buying from you.
How to Measure CES (Customer Effort Score) in 5 Steps
Measuring your CES depends on the type of customer satisfaction survey deployed. You want a high answer rate on these CES surveys. Making sure your surveys are simple and straightforward will increase the answer rate. Surveys should typically be a singular question or statement, with a maximum of two questions or statements.
1. Design Your Customer Effort Score Survey
The first step in measuring CES is to design an effective survey. A typical CES survey consists of a single question that asks customers to rate their experience based on the ease of completing a specific task, such as resolving an issue or making a purchase. You have the option to format this question as a statement or a direct question.
- Statement Format: “How much do you agree with the following statement: The company made it easy to address my concerns.” This format is well-suited for a .
- 1-7 Likert scale
- Direct Question Format: “How much effort did it take to solve your problem?” This format works best with s or Happy/Unhappy face metrics.
- 1-10 scale
While both formats can yield valuable data, the statement format is recommended due to its reliability in producing accurate CES scores, particularly when utilizing a 7-point Likert scale.
2. Choose Your Rating Scale
When choosing a rating scale, consider your audience and the level of detail you wish to obtain.
- 1-10 Scale: This scale allows respondents to express varying levels of effort, leading to a more nuanced understanding of s. To calculate the CES score, simply sum all responses and divide by the number of respondents.
- customer experience
- 7-Point Likert Scale: This scale provides a broader range of responses, allowing customers to express their opinions with more precision. Respondents rate their agreement with the prompt on a scale from 1 (Strongly Disagree) to 7 (Strongly Agree). While it may introduce more user friction due to the increased number of choices, it often leads to richer insights when analyzing responses.
3. Distribute Your Survey
Once your survey is designed, it's time to distribute it. Consider various channels for distribution, such as:
- Post-Interaction Surveys: Send the survey immediately after a transaction or to capture fresh feedback.
- customer support interaction
- Email Campaigns: Reach out to customers via email to gather their insights on their recent experiences with your product or service.
- In-s: Integrate the CES question directly within your app or website at strategic points in the .
- App Survey
- customer journey
4. Analyze the Results
After collecting responses, it’s crucial to analyze your CES results effectively:
- Calculate the : For a , simply sum the total scores and divide by the number of respondents to determine your average CES score. For example, if 100 customers responded with a total score of 700, your CES would be 7 (out of 10).
- Average Score
- 1-10 scale
- Identify Positive and Negative Feedback: If using a Likert scale, calculate the s who answered positively (scores of 5-7) versus those who responded negatively (scores of 1-3). Neutral responses (score of 4) can be excluded from this analysis.
- percentage of respondent
5. Take Action on Insights
The ultimate goal of measuring CES is to identify pain points and improve the customer experience. Here’s how to effectively use the insights gained:
- Identify Pain Points: Look for patterns in the feedback. Are there specific processes that consistently receive low scores? This may indicate areas requiring immediate attention.
- Implement Changes: Use the data to make informed decisions about where to streamline processes, improve training for s, or enhance product usability.
- customer service representative
- Track Over Time: Regularly measure CES to track improvements or declines in over time. Establishing a routine for CES surveys will help you maintain a pulse on s and make necessary adjustments.
- customer effort
- customer experience
By following these steps, organizations can effectively measure their Customer Effort Score, enabling them to create a more seamless and satisfying customer experience, ultimately fostering customer loyalty and enhancing overall business success.
What is the CES Formula?

A CES is typically calculated by the sum of all Customer Effort Scores divided by the total number of responses. For example, a survey that gives three option choices (poor, neutral, satisfied) versus 10 options will have a different benchmark for what qualifies as a strong CES.
Here is an example of how to calculate your Customer Effort Score:
- Let’s say you have 10 respondents who score your customer effort on a scale from 1–7 as 3, 5, 7, 7, 6, 4, 6, 6, 7, 7.
- Add these scores then divide by the total number of respondents.
- (3, 5, 7, 7, 6, 4, 6, 6, 7, 7) ÷ (10)
- (58) ÷ (10)
Customer Effort Score = 5.8
The below section will further explain the different survey types, when to use them, and what qualifies as a strong Customer Effort Score for each.
CES Survey Types
There are several ways to conduct customer satisfaction surveys. All of them are getting to the same point though: On average, how much effort do customers put forth to complete a particular action. The below surveys should be implemented depending on the experience the customer went through.
The Likert scale
The Likert scale can be used to measure satisfaction, agreement, desirability, and frequency. For instance, you might measure frequency by asking how often a client uses your software (Never, Rarely, Sometimes, Often, Frequently). Generally, the Likert scale uses a 7-point scale.
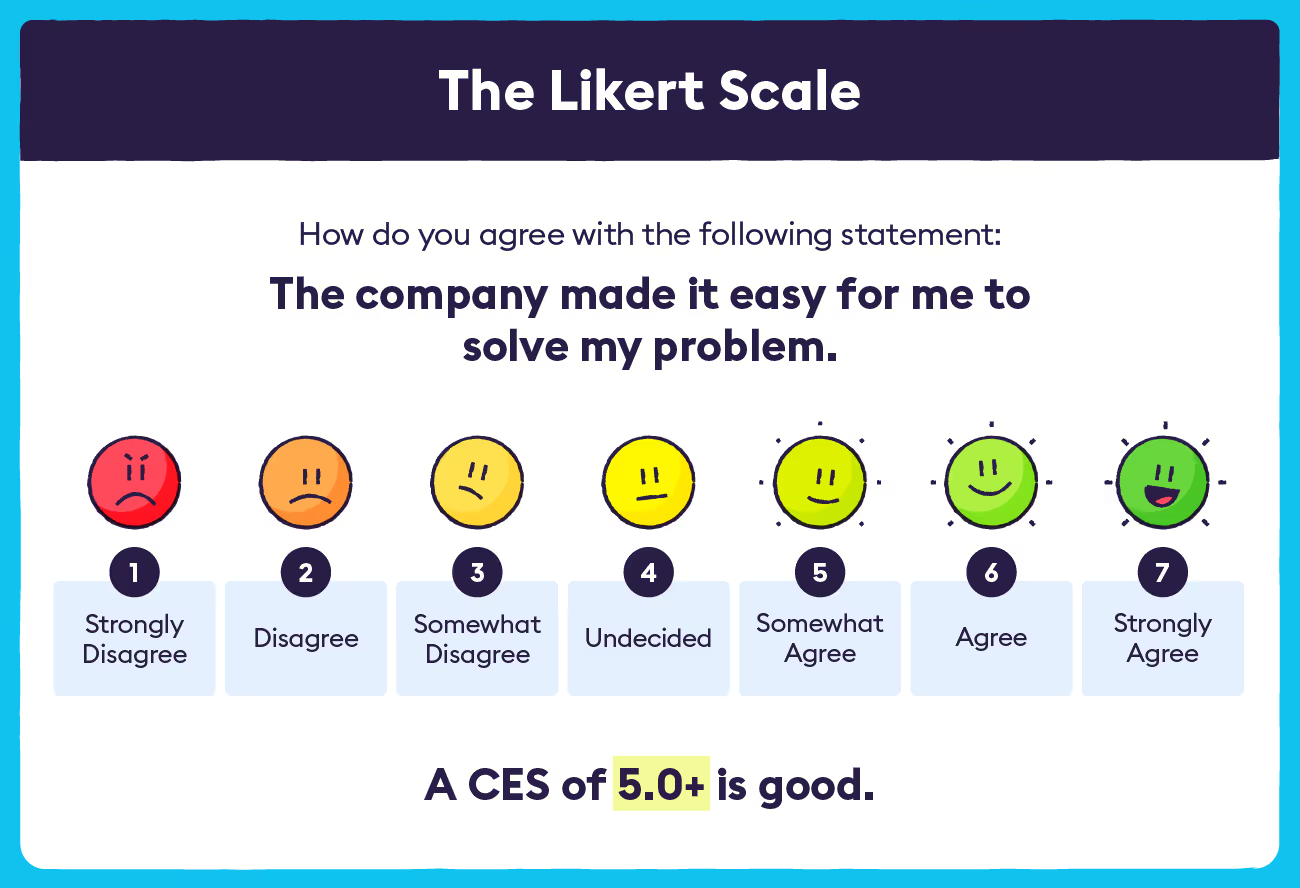
The 1–5 scale
This is a form of the Likert scale. For some surveys, you might want fewer answer choices due to there not needing to be as much variation, i.e. dropping the scale from seven to five.

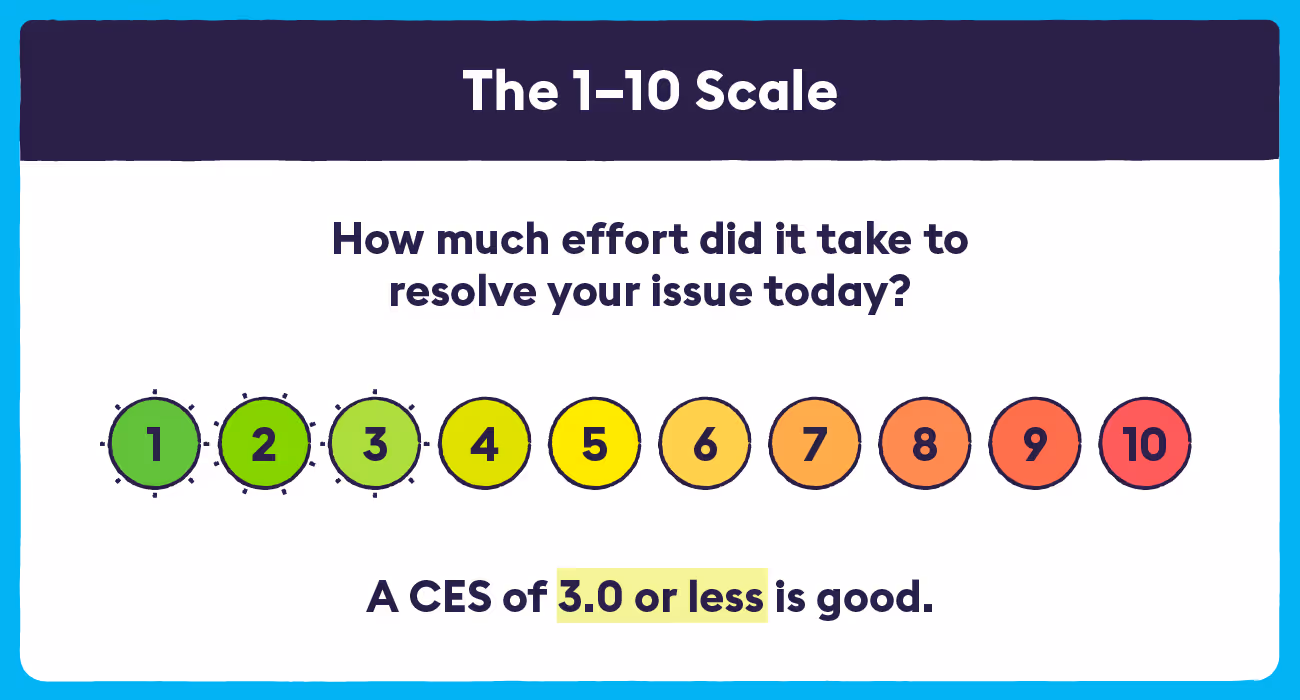
The 1–10 scale
The 1-10 scale easily translates your raw data to a CES score because of its focus on a numeric rating. Be mindful of how numbers are associated with negative and positive responses though. For example, typically higher numbers (8, 9, and 10) are associated with positive responses. However, if you're asking the surveyee to rate the level of effort it took to resolve a problem you want your lowest numbers (1, 2, and 3) to be associated with low effort and your higher numbers to equate with high effort.
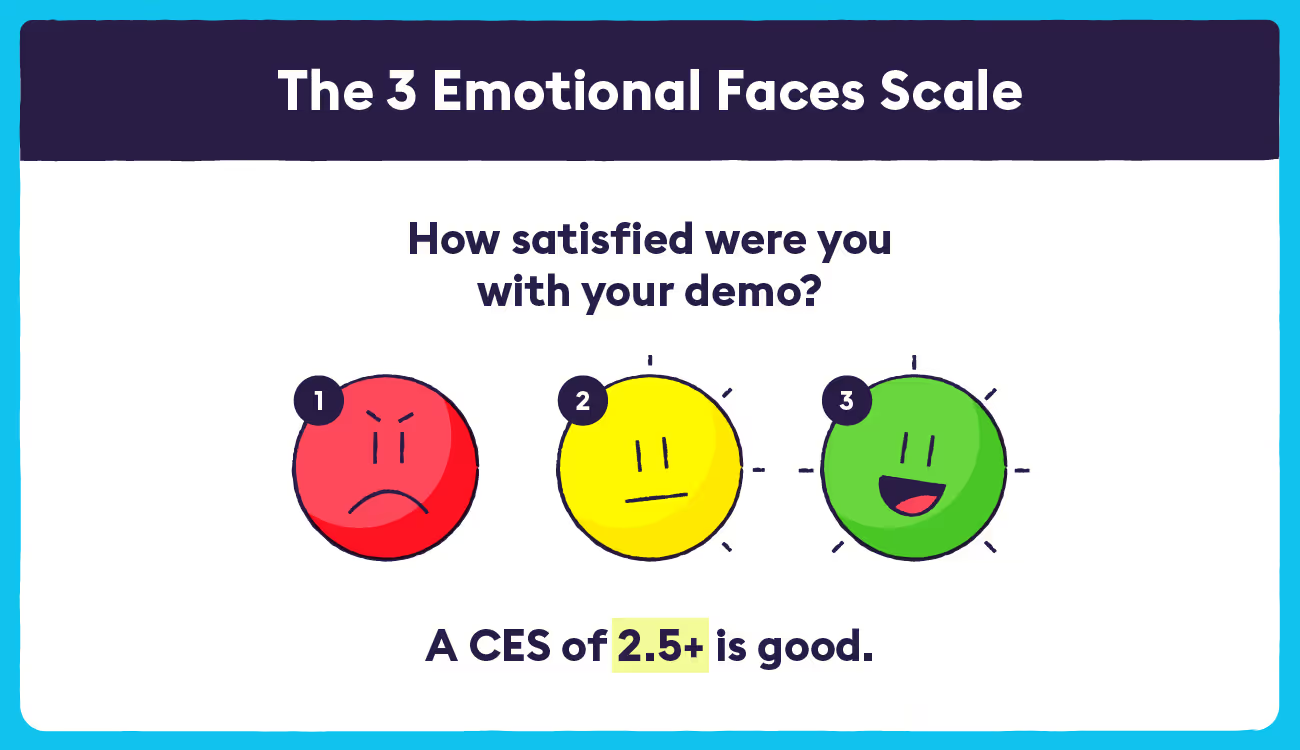
The three emotional faces scale
This survey is quite short because it only gives three options. This type of survey can be used frequently due to its brevity. It can also be used as a supplemental survey to one of the surveys listed above.
Advantages and Disadvantages of CES
CES and customer satisfaction surveys have pros and cons, but the pros heavily outweigh the cons as you get insights into specific touch points that need to be addressed and can predict future purchasing behavior.
Advantages
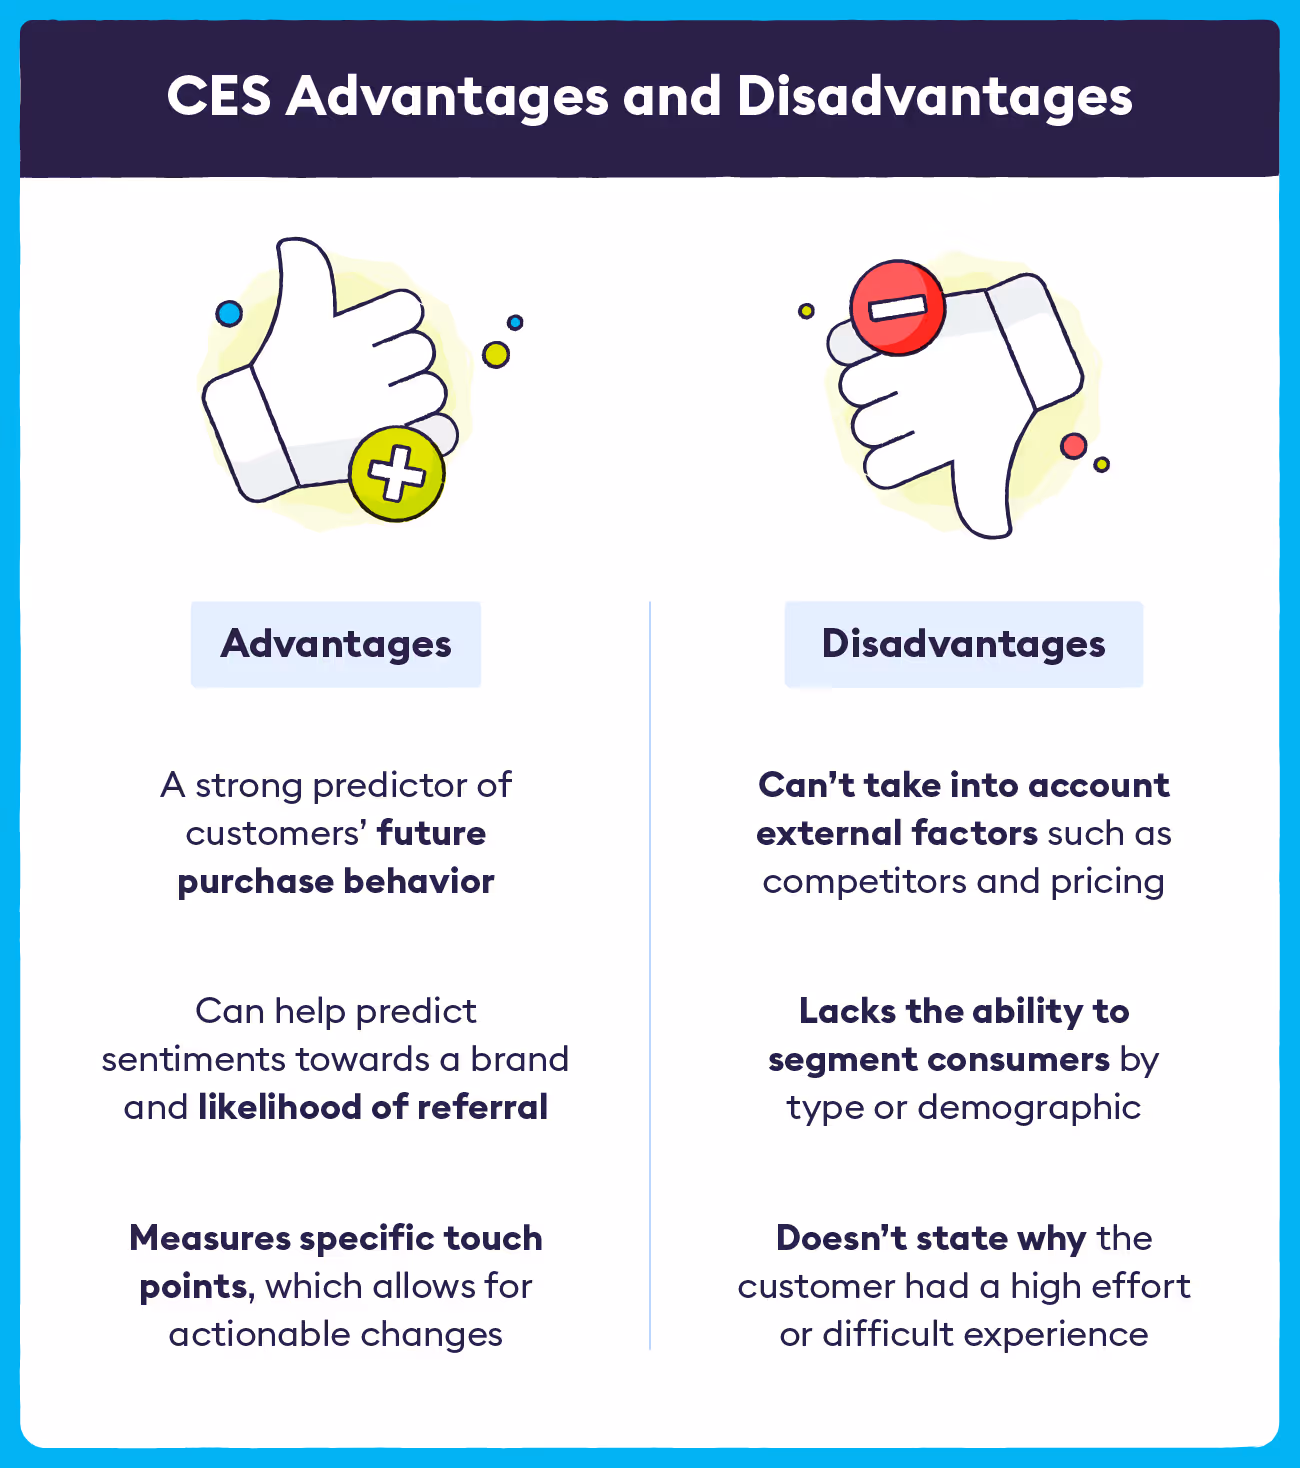
The strongest endorsement for measuring CES is that it has high predictive power for customer loyalty. According to a Harvard Business Review (HBR) study, 94% of customers who reported they experienced low effort interactions with a company said they would repurchase. While 88% of the same consumers stated they would increase their spending.
Furthermore, CES gives insight into how likely customers are to refer your brand or business to others. According to the same HBR study, close to 81% of customers who reported they had difficulty or put in high effort when interacting with a company intended to speak negatively about the brand.
Another key advantage for CES surveys is their ability to quickly take survey responses and turn that information into actionable steps. Since many customer satisfaction surveys measure one touchpoint, rapid changes can be made to resolve that bottleneck. Moreover, you can begin to A/B test these changes and will gain further insight by conducting future CES surveys.
Disadvantages
One negative or limitation to CES is that you can’t take into account or measure how consumers’ ratings or opinions of a brand are influenced by external factors such as competitors, pricing, or other products.
Another limitation is the inability of CES surveys to segment customers by type or demographic. For instance, you would have difficulty knowing if one age group is more turned off by your company’s CX than another age group.
3 Ways to Improve your Customer Effort Score
Going to the troubling of deploying CES surveys and collecting that information serves little purpose unless direct action is taken. You want to improve your CX as much as possible to obtain recurring customers and to expand your organic traffic. Here are a few simple ways to improve your CES.
1. Have a mobile-friendly website
In today’s digital landscape, a mobile-friendly website is no longer a luxury; it’s a necessity. With more than half of all online interactions occurring on mobile devices, businesses must prioritize creating a seamless mobile experience to meet the expectations of their customers. A responsive design that adapts to various screen sizes ensures that users can easily navigate your site, access information, and complete transactions without frustration.
According to OuterBox:
- It’s estimated over 50% of all eCommerce purchases during the 2022 holiday season were made on a smartphone
- eCommerce dollars now comprise 15% of ALL retail revenue
- 80% of shoppers used a mobile phone inside of a physical store to either look up product reviews, compare prices or find alternative store locations
User Experience and Design
The first step in optimizing for mobile is ensuring that your website is user-friendly. This involves simplifying navigation, minimizing loading times, and making important information easily accessible. Key elements to consider include:
- Responsive Design - Your website should automatically adjust to fit any device's screen, whether it's a smartphone, tablet, or desktop. This adaptability enhances the browsing experience and reduces the chances of visitors abandoning your site due to compatibility issues.
- Clear Call-to-Action (CTA) - Make your CTAs prominent and easily clickable. Buttons should be large enough for users to tap without difficulty, and they should convey clear instructions, such as “Shop Now” or “Contact Us.”
- Streamlined Content - Mobile users typically seek quick answers and convenience. Trim down unnecessary text and graphics that may clutter the screen. Instead, focus on delivering concise, impactful content that guides users to take action.
Testing and Feedback
Regularly test your website on various mobile devices and screen sizes to ensure a consistent experience. Utilize user feedback as a tool for continuous improvement. You can incorporate customer effort score (CES) surveys directly after key interactions on your mobile site, asking users about their experience and ease of navigation. These insights are invaluable for identifying pain points and making necessary adjustments.
In conclusion, a mobile-friendly website is crucial for reducing friction in the customer journey and enhancing overall satisfaction. By investing in responsive design, optimizing performance, and actively seeking feedback, businesses can create a more enjoyable and efficient mobile experience, ultimately driving customer loyalty and increasing conversion rates.
2. Reduce average response times
Some customer's issues are more pressing than others. Make sure that you have a way to automate and silo which complications take priority. For instance, if a payment fails for a customer or your software crashes these should be dealt with as soon as possible, while someone's general inquiry about a product can be scheduled to reply to at a later time.
3. Try new low-effort tools
In today’s fast-paced digital landscape, customers increasingly value their time and seek seamless interactions with brands. To meet this expectation, businesses must explore and implement new low-effort tools that enhance the customer experience. By prioritizing ease of use, companies can foster loyalty, encourage repurchases, and minimize operational costs.
Chatbots and AI Assistants
Integrating chatbots and AI-powered assistants into your customer service strategy can significantly reduce effort for customers. These tools provide immediate responses to common inquiries, guiding users through troubleshooting processes or directing them to relevant resources. By addressing customer needs 24/7, chatbots not only improve accessibility but also free up human agents to handle more complex issues, thereby optimizing overall service efficiency.
Interactive Voice Response (IVR) Systems
Modern IVR systems can enhance the customer experience by simplifying call routing and offering self-service options. By utilizing natural language processing, these systems can understand and respond to customer inquiries without the need for complicated menu navigation. This streamlining can reduce frustration and lead to quicker resolutions, improving customer satisfaction and loyalty.
What is the Difference Between CES and Net Promoter Score (NPS)
CES surveys give insight into specific customer touch points and measure customer satisfaction. That being said, it's best to pair your CES metric with another customer satisfaction survey, Net Promoter Score (NPS).
An NPS survey typically asks on a scale of 0–10 how likely a customer is to recommend a company to someone they know. The response groups are then broken into three distinct buckets — promoters (scored 9–10), passives (scored 7–8), and detractors (scored 0–6). The percentile of groupings can then be calculated to give you an NPS score. NPS also allows for more customer segmentation and further data analysis that your CES does not.
With CES surveys measuring the level of effort and NPS surveys measuring the likelihood of referral, you get keen insight into how a consumer interacted and responded to your company and their loyalty level. According to one Gartner Study, top-performing companies with low-effort scores typically have an NPS of 65 points higher than similar companies who were ranked as having high-effort scores.
How to Use CES and NPS Together
Together, CES and NPS measure both consumer effort and loyalty. The two metrics complement each other because CES pinpoints specific customer experiences while NPS gives a broad view of an organization’s relationship with its customers. Use CES to address and tackle low-hanging improvements. And implement NPS surveys to gain a more robust understanding of the customer journey.
The combined deployment and implementation of CES and NPS surveys will give you a comprehensive overview of customer satisfaction and sentiment. Once you have sufficiently tracked and analyzed these measurements, make sure you take actionable steps to further satisfy your customers.
In Conclusion
Understanding and implementing the Customer Effort Score (CES) can significantly enhance your organization's approach to customer satisfaction. This valuable metric not only sheds light on how easy or difficult it is for customers to interact with your business but also provides actionable insights that can lead to improved customer experiences and increased loyalty.
By actively monitoring CES alongside other metrics such as Net Promoter Score (NPS), organizations can gain a nuanced understanding of both customer effort and loyalty. The insights derived from CES can guide efforts to streamline processes, reduce friction, and create a more effortless experience for customers, ultimately leading to higher satisfaction rates.
As competition increases, the importance of a hassle-free experience cannot be overstated. Companies that prioritize reducing customer effort often realize tangible benefits, including better retention rates, enhanced customer advocacy, and positive word-of-mouth. Therefore, integrating CES into your customer feedback toolkit isn’t just beneficial—it’s essential for creating a customer-centric organization.
In summary, measuring customer effort is a critical component of building strong customer relationships. It allows businesses to pinpoint areas needing improvement and ensures that they remain responsive to customer needs in an ever-evolving marketplace. By focusing on reducing customer effort, organizations can foster loyalty, drive growth, and achieve long-term success. Through thoughtful implementation and continuous refinement, CES can empower companies to deliver exceptional customer experiences.
Sources: Gartner | Harvard Business Review | OuterBox | Gartner
Customer Effort Score (CES): FAQs
What is Customer Effort Score (CES)?
Customer Effort Score (CES) is a customer experience metric that measures how easy it is for customers to complete an interaction with a company, such as resolving an issue, making a purchase, or getting support.
Why is CES important?
CES is important because it directly correlates with customer loyalty. The easier it is for customers to achieve their goal, the more likely they are to return and recommend the company. High effort, on the other hand, increases the risk of churn.
How is CES measured?
CES is measured through a survey question that asks customers to rate the ease of their experience, typically on a 5-point or 7-point scale. The responses are then averaged to produce a score that reflects overall customer effort.
When should you use CES surveys?
CES surveys are best used immediately after a customer interaction, such as completing a purchase, resolving a support ticket, or navigating a self-service system. This timing ensures feedback is fresh and accurate.
How does CES differ from NPS and CSAT?
- CES measures ease of interaction.
- NPS measures likelihood of recommendation.
- CSAT measures satisfaction with a specific interaction.
Together, these three metrics provide a comprehensive view of customer experience.
What is considered a good CES score?
A good CES score is generally one where the majority of customers rate their experience as easy or very easy. While benchmarks vary by industry, higher scores consistently indicate lower friction and stronger customer loyalty.
How can businesses improve CES?
Businesses can improve CES by simplifying processes, reducing wait times, improving self-service options, and empowering support teams to resolve issues quickly. Proactive communication also helps reduce customer effort.
Can CES predict customer loyalty?
Yes. Research shows that reducing customer effort is one of the strongest predictors of repeat business and loyalty. Customers who find interactions effortless are far more likely to stay with a brand long-term.