Qualitative Vs Quantitative Data: What’S The Difference?


The CX intelligence
platform that's AI-native by design
Book a demo
When it comes to improving your brand’s overall customer experience, your biggest asset is your customers. Their feedback is data — data that can be transformed into a strategic plan for correcting pain points and retaining customers. Of course, the type of data you collect should be decided strategically so that you can paint the clearest possible picture of the problem. That’s where qualitative vs quantitative data comes in.
Marketers, researchers, and customer experience specialists alike should understand the difference when it comes to qualitative vs quantitative data, as each provides unique insight into the customer’s mind. This guide will unpack each type of data and explore how and when to use each so that you can fine-tune every stage of your customers’ journey.
The Main Difference Between Qualitative And Quantitative Data
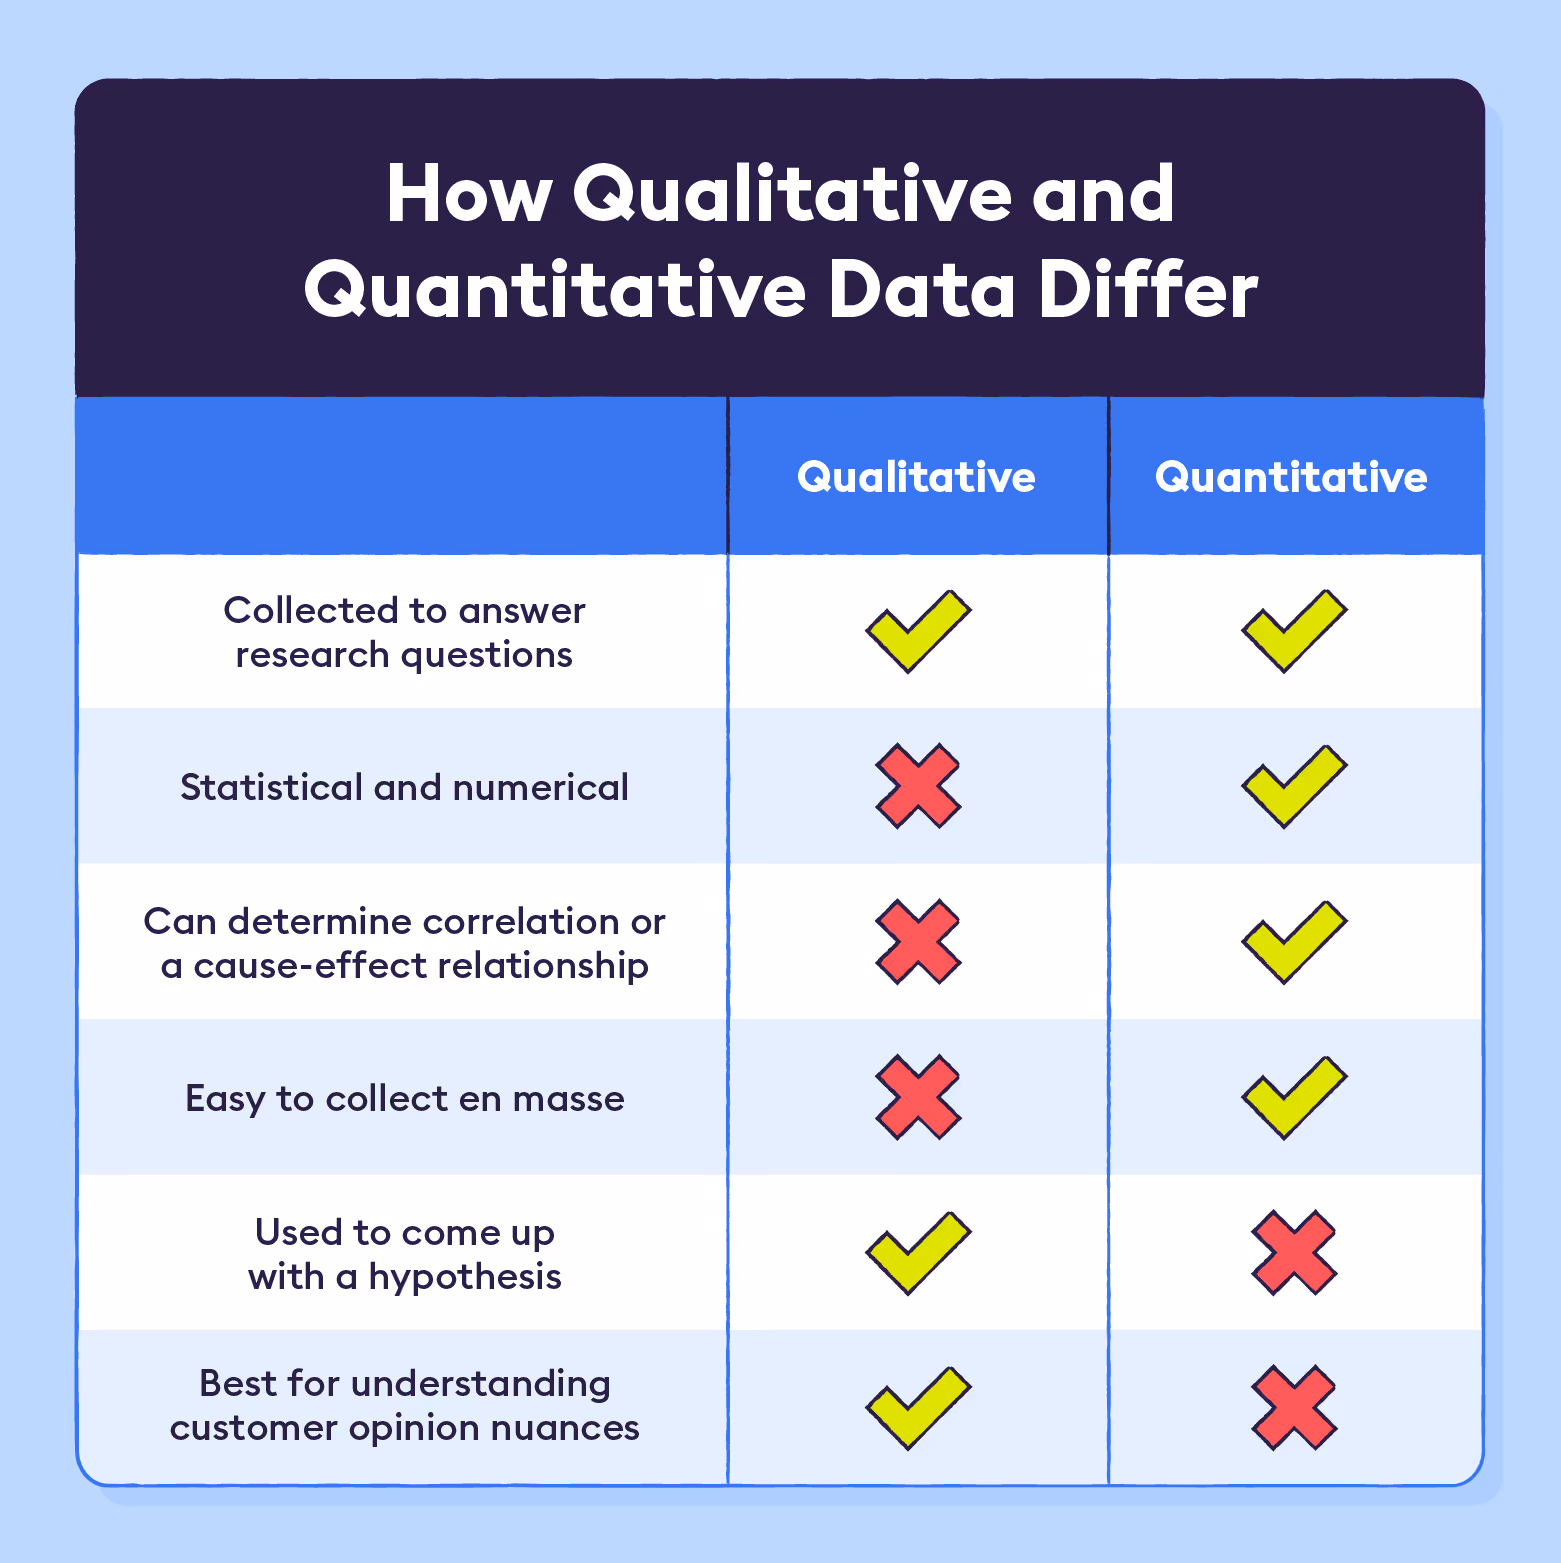
Simply put, the main difference between quantitative and qualitative data is that quantitative data refers to numbers that can be counted, measured, and plugged into mathematical equations. It also refers to data collected from closed-ended (e.g., yes/no) questions, as this can easily be coded and statistically analyzed.
In contrast, qualitative data is more conceptual and descriptive — it tends to be observed and recorded. For example, a written survey response detailing a customer’s opinions on your new product would be considered qualitative data.
Imagine conducting a survey and learning that 140 out of 200, or 70%, of the participants claim that they like your website’s new layout. This data is quantitative in nature because it expresses a certain quantity, amount, or range. Qualitative data goes a step further, providing insight into why customers do or don’t like the new layout. This type of data explains the “meat” of the problem and will help you accurately target your CX improvements.
What Is Qualitative Data?
Qualitative data is non-numerical, non-statistical, and unstructured or semi-structured. Unstructured data refers to information that can’t be plugged into a predefined format, such as a spreadsheet. Semi-structured data is a hybrid between structured and unstructured data, such as text that can be organized into topical categories, but without these categories could not fit into data tables.
Simply put, qualitative data refers to descriptions (as opposed to concrete numerical data) that has been extracted from respondents. It often takes the form of opinions, properties, and attributes. Due to the unstructured nature of this data, companies conducting customer research often struggle to place qualitative data on a nice, structured graph.
Despite its usefulness, qualitative data can be difficult to collect at scale. It requires far more effort from the respondent, and its lack of uniformity warrants a lot of time spent organizing once it’s collected.
Qualitative Data Examples
Let’s say you’re fielding a survey on how customers perceive the online checkout process when buying your product(s) or service(s). A prompt seeking to collect qualitative data may read, “Describe your experience when entering your payment information.” Responses may read:
- “The page took too much time to load.”
- “My card was processed immediately.”
- “I wish there was an option to save my credit card information for later.”
- “I had to try three different cards for the system to work.”
As you can see, this data is highly informative and points to specific areas where the checkout process can be improved, but it’s non-numerical, non-statistical, and since it’s written out, it demands more effort from the respondent.
Types Of Qualitative Data
Before we dive deeper into the differences between qualitative and quantitative data, it’s important to understand the two types of qualitative data: nominal and ordinal.
Nominal Data
When you think of nominal data, think of categories. Survey respondent characteristics such as gender, race, hair colour, and country of origin are all considered nominal data. Since you can’t perform a mathematical equation on categories, this data type is usually classified as qualitative.
Ordinal Data
Ordinal data can be best expressed as rankings. If you conduct a survey or questionnaire and ask respondents to rank five of your products in order of preference on a scale of one to five, you’re collecting ordinal data.
Although ordinal data is technically expressed using numbers, it doesn’t provide the relative differences between each item in the list. This means you don’t know how much the respondent likes one item more than another — all you know is that they like it better than the one below it. For this reason, this data type is often classified as qualitative.
However, some claim that its classification can go either way — qualitative or quantitative — since you can, to an extent, statistically analyze rankings.
What Is Quantitative Data?
Quantitative data is statistical, numerical, and rigid. It is usually collected using concise and closed-ended survey questions. This type of data can be analyzed and converted into data visualizations, such as bar charts, far more easily than qualitative data.
If you’re wondering how to make quantitative data look good, Chattermill dashboards make it easy to create data visualizations that turn customer feedback into engaging stories that inform CX strategy.
While quantitative data tends to be more straightforward, easy to collect, and easy to conceptualize than qualitative data, it often merely identifies trailheads or general areas of concern rather than diving into the “why” needed to tell a customer’s story.
Quantitative Data Examples
When conducting a survey with a huge number of people, chances are you plan to collect a lot of quantitative data. Some examples of quantitative data include a customer responding that they:
- Purchased $150 worth of your product.
- Visited your site three times last month.
- Spoke with a customer service representative once.
All of this data is numerical and thus can be easily compared to other respondents or time periods. It’s much easier for a respondent to select a number than it is for them to write out a response. That said, these pieces of information lack the why and how that qualitative data provides.
Of course, quantitative data can still be used to collect opinions, if the company already has an idea of what the customer may care about. For example, a survey prompt may read:
To what extent does our website runs smoothly:
- Always
- Most of the time
- About half of the time
- Not very often
- Never
You can get a decent idea of a customer’s perception of the website’s speed from their answer to the above question. However, their answer won’t tell you what “smoothly” means to them, which pages are loading the slowest, how the website can be improved, etc. The question gives them limited ability to express their valuable thoughts and opinions.
Types Of Quantitative Data
Quantitative data can be broken down into two categories: discrete and continuous. Let’s explore each to clarify what quantitative data can look like.
Discrete Data
Discrete data is a form of quantitative data that can only take certain values and cannot be broken down into smaller parts. Discrete data can only take the form of fixed values, meaning that there are rules guiding what it can be. For example, a customer’s rating of your website’s accessibility on a five-star rating scale is discrete data, as no rating under zero stars or over five stars is accepted.
Continuous Data
On the other hand, continuous data is quantitative data that can be broken down into smaller parts and can fluctuate. For example, a customer’s weight is continuous because weight can be broken down into pounds, ounces, grams, etc. A customer’s weight can also fluctuate — we tend to weigh less first thing in the morning than we do after we eat breakfast.
On the other hand, continuous data is quantitative data that can be broken down into smaller parts and can fluctuate. For example, a customer’s weight is continuous because weight can be broken down into pounds, ounces, grams, etc. A customer’s weight can also fluctuate — we tend to weigh less first thing in the morning than we do after we eat breakfast.
Qualitative Vs Quantitative Data: Which Is Better For Data Analysis?
Now that we’ve made qualitative and quantitative data a bit more digestible, how do you decide which to use?
While qualitative data can be extremely informative, it’s also notoriously difficult to analyze. It’s unstructured, non-numerical, and sometimes messy. However, there are some methods that can be used to add structure to qualitative data, making it easier to work with.
For example, you can use qualitative coding or metadata to break down a qualitative response into smaller pieces that are easier to understand, organize, and work with. Powerful data analytics tools like Chattermill use such methods to organize qualitative data and tell a cohesive customer story.
Quantitative data, however, is naturally far easier to analyze and organize, as it’s already numerical and structured.
Consider a digital spreadsheet on Microsoft Excel or Google Sheets. While you can organize, analyze, and extract so much information from numerically expressed data using these tools, it’s a lot more difficult to use them to manage descriptive, non-numerical data.
How To Collect Qualitative Data: 6 Research Methods

Qualitative research is highly dependent on the observation of a target audience, and the data extracted from these observances tend to be subjective. The following methods are some of the most commonly used for qualitative data collection.
Focus Groups
Focus groups are one of the most popular strategies that companies use to collect qualitative data from respondents. They involve gathering a group of five to 10 people together to discuss a topic. The focus group leader may ask participants to explain their responses to questions in greater depth or may ask for a second participant’s thoughts on an answer given by the first participant.
While costly and time-intensive, focus groups provide a great deal of insight into customer thoughts and interests, which can be used to inform customer acquisition and retention efforts.
Ethnographic
Ethnographic research involves closely observing subjects in a specific geographic location. It is often used to detect cultural or regional differences in behaviours or uses of a product or service to better understand how to adapt said product or service for a specific audience.
For example, when observing people of a certain culture going through the checkout process on a website, you may notice that they tend to feel less comfortable entering their personal information on a website than people of another culture. By communicating customer privacy more explicitly, you may better meet the needs of customers of certain cultural backgrounds.
Phenomenological
Phenomenological studies are designed to explore the meaning and impact that experiences have on a subject, often through the use of interviews. When conducting these studies, it’s important for the researcher to consider their bias about a certain experience ahead of time and put it to the side.
For example, when asking a customer how frustrated they feel when the site takes several seconds to load, your company’s head of research might feel like it would be highly frustrating, but the customer may respond that it’s no big deal. Phenomenological research is a great method to develop empathy for the end user and discover ways to improve your customer experience.
Case Study
A case study is a detailed analysis of organizations or people in a real-world context used to draw inferences. In the world of customer experience, a case study may be used to analyze an instance in which a company failed to keep customers top-of-mind and ended up falling apart as a result.
Historical
Historical studies involve looking at data from the past and using it to inform present and future decisions. Understanding the history of a process like customer support, for example, can help you understand mistakes to avoid or successes to replicate.
Action Research
Action research involves having participants take a certain action, then analyzing the results of that action and using it to inform decisions. In action research, the organization itself might be the subject taking the action.
For example, a company might redesign its website, trying out a new format. If the company sees sales drop significantly the following month, it can dive into what went wrong and improve it for the future.
How To Collect Quantitative Data: 5 Research Methods
Quantitative research involves collecting and analyzing numerical data using quantitative methods. It is commonly used to determine the type of relationship that exists between factors. For example, if you wanted to learn whether the amount of money you spend on advertisements has a positive impact on the number of visits made to your site, you would collect quantitative data.
Here are some of the most common quantitative research methods.
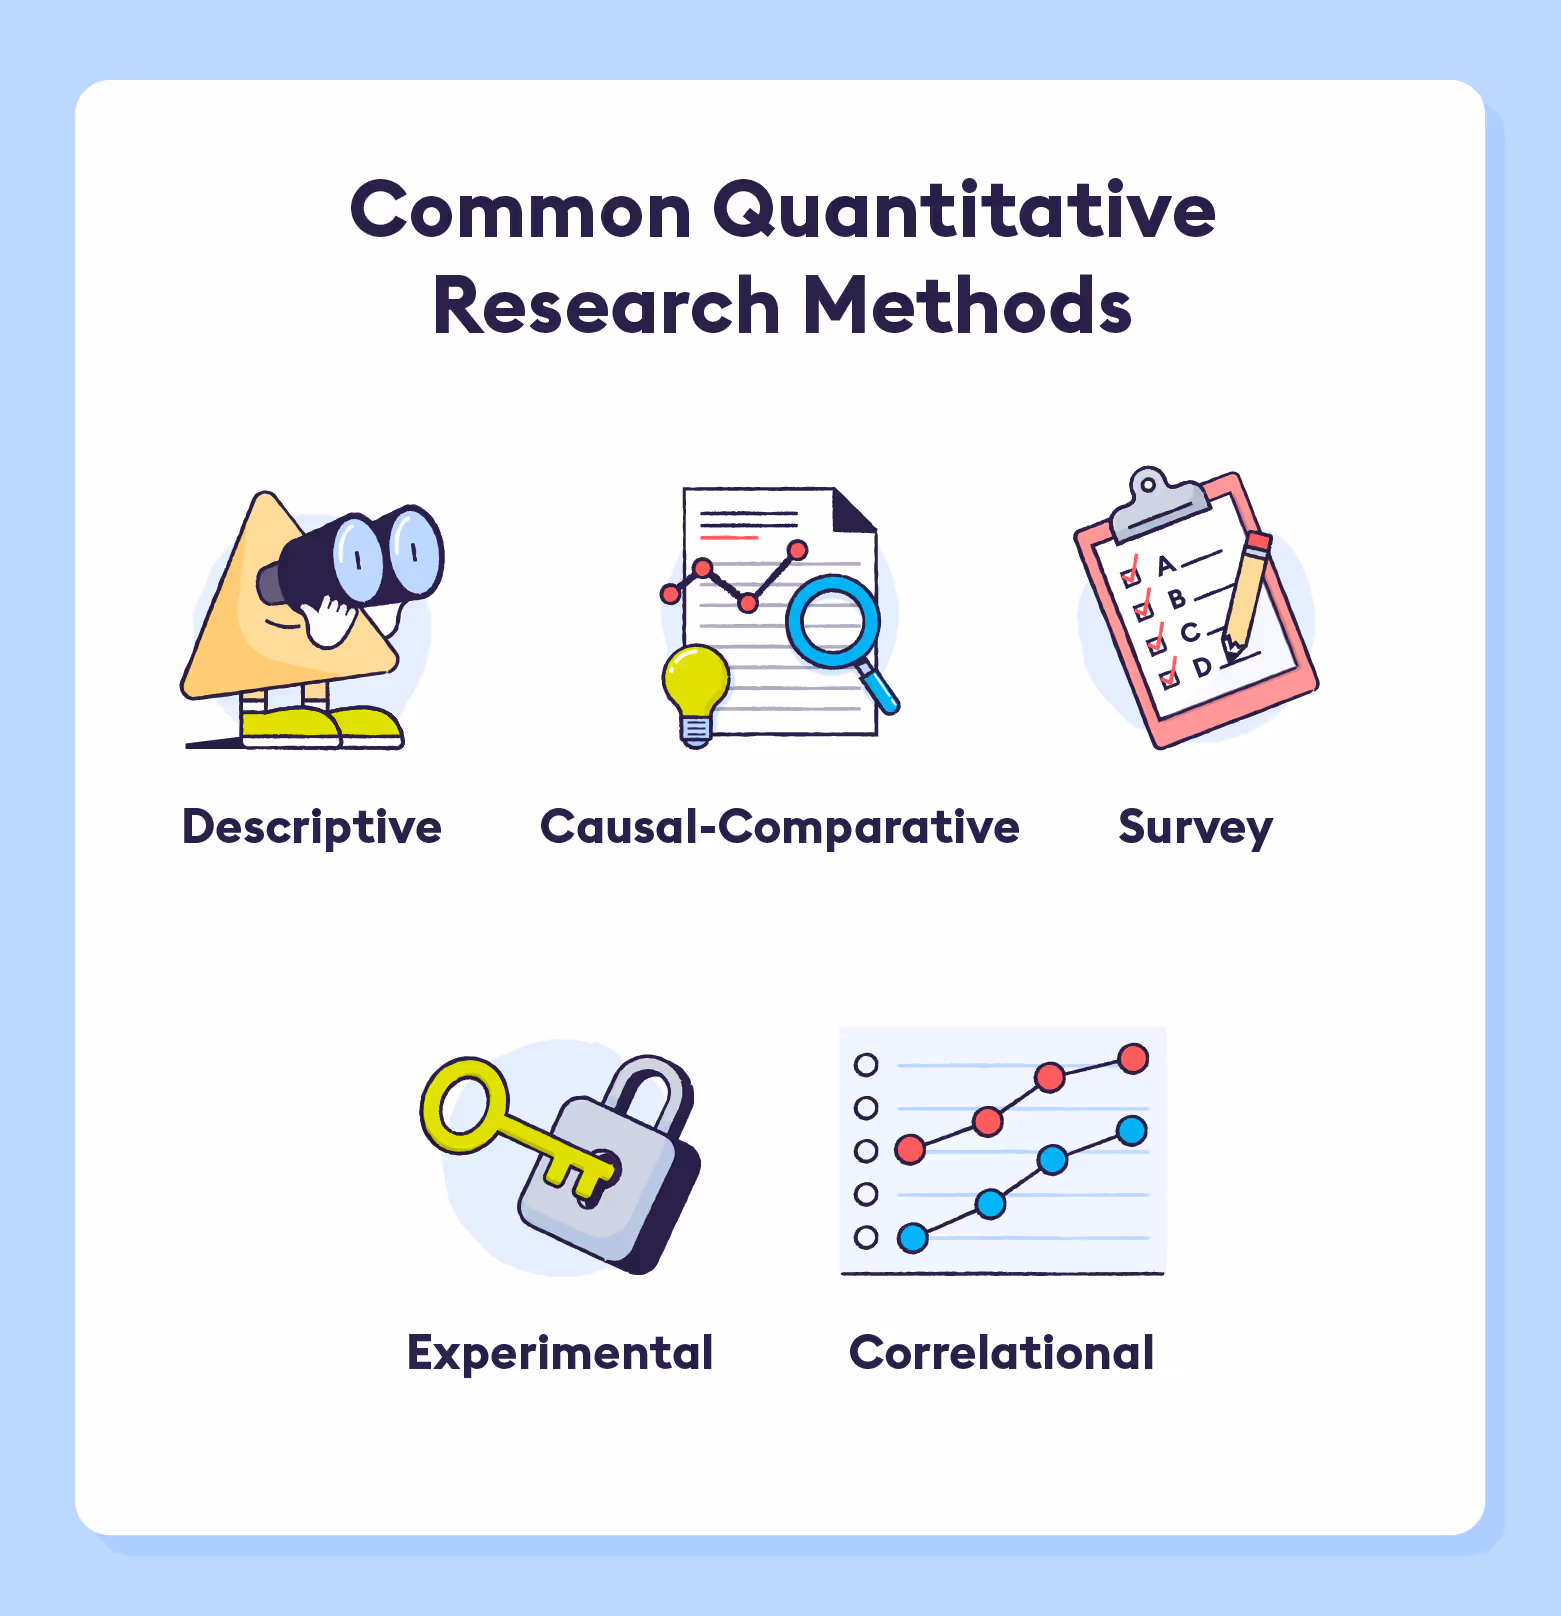
Survey
Survey research is a highly popular form of data collection that is used by nearly every type of institution, from governments to corporations to nonprofits. After feedback is collected through a survey or questionnaire, it is organized and analyzed to understand a group’s characteristics and opinions. This data can then be used to make organizational changes with confidence.
Descriptive
While most research methods involve testing a hypothesis, descriptive research simply involves observing a certain variable and describing it. The data gathered from studying a variable will likely form a hypothesis naturally. While this may sound a lot like qualitative research, what makes it quantitative is that these details are collected for the purpose of statistical analysis. If you’re unsure where to begin your study, descriptive research is a great place to start!
Correlational
Correlational research uses statistical data to determine whether there is a relationship between certain interdependent variables and, if so, how strong that relationship is. While this method is great for identifying trends and patterns, it cannot be used to determine whether one variable causes another.
For example, correlational research may determine that typically, company transparency goes hand-in-hand with customer trust. However, it cannot determine that when company transparency increases, so does customer trust. Determining whether there is a causal relationship between these factors would require deeper research and data collection.
Experimental
Experimental research is used to determine whether a cause-effect relationship exists among variables. It requires controlling all but one factor and studying whether and how a change in that factor impacts the others.
Experimental research can be challenging to conduct in the real world, especially when studying human behaviour, as there are countless extraneous factors that could impact results. For example, if many of your company’s products go on sale at the beginning of November and you sell significantly more that month than you did in October, you couldn’t necessarily conclude that discounts cause a significant increase in sales. Customers may just be doing their Christmas shopping and would have purchased more items in November regardless of the sale.
For this reason, experimental research is often conducted in a highly controlled setting, where only one factor is changed and all potential extraneous factors (interferences) are either eliminated or taken into account.
Causal-Comparative (Quasi-Experimental)
Causal-comparative research, also known as quasi-experimental research, involves studying the effect of an independent variable on a dependent variable to determine causality. While similar to experimental research, there’s no manipulation of the independent variable in causal-comparative research.
For example, a company might classify site speed as the independent variable and watch how its natural fluctuations, such as slower speeds when site traffic is high, impact customer bounce rate. Essentially, this form of research is more natural and less controlled than experimental research.
When To Use Qualitative Vs Quantitative Research
While quantitative research can help you understand trends and big ideas, it takes qualitative research to obtain the details and understand the human “why” behind the numbers.
Here are the instances when each data collection method comes in handy:
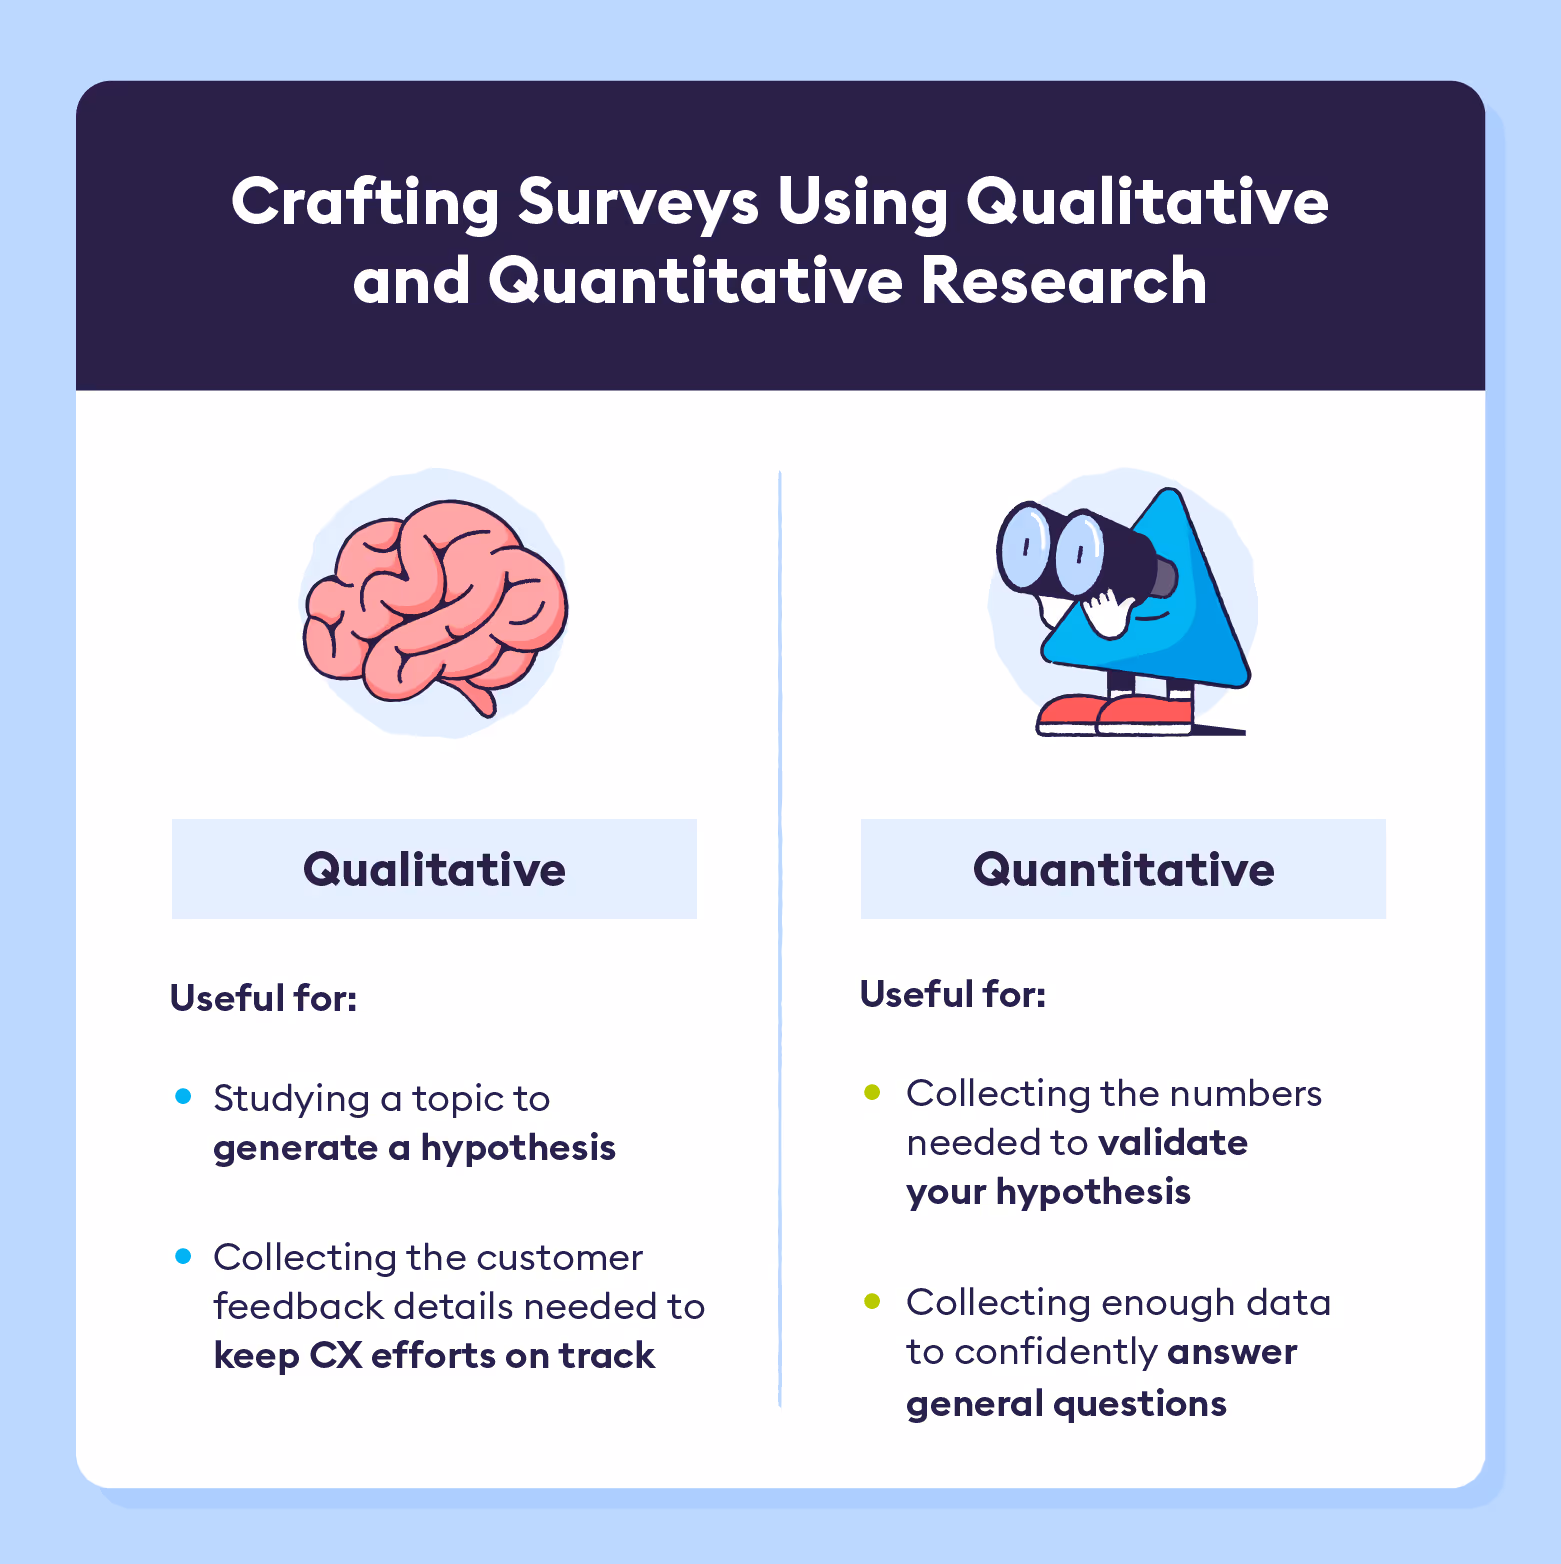
Brainstorming a hypothesis — Qualitative
A hypothesis is essentially an educated guess, and the best way to become educated on a topic is to ask questions. Qualitative questions are best for learning the details (such as context) surrounding an issue, and thus will help you form an appropriate hypothesis.
Accepting or rejecting the null — Quantitative
Simply put, accepting or rejecting the null hypothesis means learning whether your hypothesis holds up under pressure. Quantitative research will provide you with the numbers needed to statistically confirm that the issue you were told about when you formed your hypothesis is valid and worthy of being explored further.
Finding general answers — Quantitative
Quantitative research does a great job of collecting answers to general questions, as it’s far easier to field a survey to a large sample than it is to conduct interviews, focus groups, and ethnographic studies. For example, a quantitative survey is a great way to learn which of your competitors has the greatest brand awareness.
Filling in the blanks — Qualitative
Qualitative data provides the context needed to tell a complete story. A 35% satisfaction score makes a lot more sense when your respondents are given the opportunity to share their experience with a rude customer service representative, their struggle to understand the checkout process, and their annoyance with website pop-ups. When interpreting data and reporting your findings, qualitative data can remind you that everything you’re working to improve goes back to your customers and their experiences.
Ultimately, qualitative and quantitative data each offer information that’s necessary to comprehensively tackle a hypothesis and decide what action needs to be taken.
Why Collect Qualitative Data?
Collecting qualitative data is expensive and time intensive, so why do it in the first place? Aside from kicking off research by helping you identify a hypothesis, qualitative data can help keep you on track as you use survey data to inform your customer experience improvements.
Without allowing survey respondents to express their thoughts on the matter at hand freely, you run the risk of misinterpreting the numbers, resulting in wasted time and money. Imagine learning from quantitative survey data that customers see your website as less intuitive than the competition. Without the help of qualitative data, you may improve the area you believe needs the most work (e.g., the checkout experience) and ignore the areas that the customer was trying to call attention to (e.g., the UX of the home page).
While qualitative data is often criticized for its subjectivity and non-numerical nature, it can be coded into quantitative metrics to organize the data and compare it to other data. With the help of Chattermill, you can even label, group, and filter your qualitative data to organize it and uncover valuable insights.
Ultimately, if you have the time and the budget to collect qualitative data, it only helps to do so! While not every project may warrant several focus groups or ethnographic studies, it can go a long way in humanizing the numbers and helping to develop a clear action plan.
Why Collect Quantitative Data?
There are several reasons why companies like to lean more heavily on quantitative data than qualitative data, especially when conducting surveys. Qualitative questions can be interpreted differently by every participant while quantitative questions are more clear and concrete.
For example, a company is more likely to get a clear answer asking customers to rate how well a customer representative answered their questions on a scale of one to five than to ask, “How was your experience with the customer representative?”
Not only does quantitative data carry more concrete meaning, but it’s also easier for the respondent to circle a letter than it is for them to write out a long response. If a respondent comes across too many questions asking for a written response, they may not finish the survey.
In summary, quantitative data is numerical, statistical, and rigid while qualitative data is non-numerical, unstructured, and opinion-driven. While brands tend to rely more heavily on quantitative data due to how much easier it is to collect and manipulate, the details that qualitative data provides to humanize data and keep action plans relevant keep it popular among companies and data scientists.
Data is powerful, but leveraging it well might take some study and practice. If you’ve collected quantitative and qualitative data but don’t fully understand how to use it, check out our article on customer feedback analysis so that you can enhance your CX strategy with confidence.
Qualitative vs Quantitative Data: FAQs
What is qualitative data?
Qualitative data is descriptive and non-numerical, often capturing people’s opinions, feelings, or experiences through words rather than numbers. It helps answer questions like why or how something happened and is typically collected via interviews, open-ended surveys, focus groups, or observations.
What is quantitative data?
Quantitative data is numerical and measurable. It answers questions like how many, how much, or how often, and is often gathered through closed-ended surveys, counts, or experiments that can be analyzed statistically.
How are qualitative and quantitative data different?
- Qualitative data is unstructured, subjective, and focuses on meanings and insights; quantitative data is structured, objective, and focuses on numerical evidence.
- Qualitative asks why or how; quantitative asks what, how many, how much.
- Qualitative data analysis involves grouping responses into themes; quantitative analysis uses numbers, charts, and statistical methods.
Can data be both qualitative and quantitative?
Yes. For instance, categorical variables (like occupation or country) are qualitative by nature, while numeric variables (like income or number of children) are quantitative. Combining both types can yield deeper insights.
When should you use qualitative data?
Use qualitative data to explore motivations, uncover user experiences, or understand nuances that numbers can’t reveal—particularly useful in early-stage research, product feedback, or when exploring new topics.
When is quantitative data more appropriate?
Quantitative data is ideal for measuring scale, frequency, or changes over time in large populations. It's efficient, easier to analyze at scale, and useful for tracking trends or validating hypotheses.
What are examples of discrete and continuous quantitative data?
Discrete data includes countable items like number of support tickets or survey ratings. Continuous data includes measurements that can vary within a range, such as weight or temperature.
How can qualitative data be quantified for analysis?
By using coding—assigning labels or themes to text responses—you can convert qualitative feedback into quantitative metrics, making it easier to compare and analyze at scale.
Why combine both qualitative and quantitative data?
Integrating both types (known as mixed-methods research) creates a more comprehensive and balanced understanding—quantitative data provides the "what" while qualitative data provides the "why."


CX intelligence
for teams and agents
Book a meeting


COMPARISONS
Chattermill Analytics Limited
68 Hanbury St, London, E1 5JL,
United Kingdom